The Human Aspect of Predictive Analytics

By Ashith Bolar , Director AmBr Labs, Amick Brown

The past decade and a half has seen a steady increase in Business Intelligence (BI). Every company boasts a solid portfolio of BI software and applications. The fundamental feature of BI is Data Analytics. Corporations that boasts large data do indeed derive a lot of value from their Data Analytics. A natural progression of Data Analytics is Predictive Analytics (PA).

Think of data analytics as a forensic exercise in measuring the past and the current state of the system. Predictive Analytics is the extension of this exercise: Instead of just analyzing the past and evaluating the current, predictive analytics applies that insight to determine, or rather shape the future.

Predictive Analytics is the natural progression of BI.

The current state of PA in the general business world is, for the most part, at its inception. Experts in the field talk about PA as the panacea – as the be-all and end-all solution to all business problems. This is very reminiscent of the early stages of BI towards the turn of the century. Hype as it may be, BI did end up taking the center stage over the ensuing years. BI was not the solution to the business problems anymore; it was indeed mandatory for the very survival of a company. Companies don’t implement BI to be on the leading-edge of the industry anymore. They implement BI just to keep up. Without BI, most companies would not be competitive enough to survive the market forces.

Very soon, PA will be in a similar state. PA will not be the leading-edge paradigm to get a headstart over other companies. Instead PA is what you do to just survive. All technologies go through this phase transition – from leading-edge to must-have-to-survive. And PA is no different.

predict the future

Having made this prediction, let’s take a look at where PA stands. Some industries (and some organizations) have been using predictive analytics for several decades. One such not-so-obvious example is the financial industry. The ubiquity of FICO scores in our daily lives does not make it obvious, but they are predictive analytics at work. Your fico score predicts, with a certain degree of accuracy, the likelihood of you defaulting on a loan. A simple number, that may or may not be accurate in individual cases, arguably has been the fuel to the behemoth economic machinery of this country, saving trillions of dollars for the banking industry as well as the common people such as you and me.

Another example would be that of the marketing departments of large retail stores. They have put formal PA to use for several years now, in a variety of applications such as product placement, etc. If it works for them, there is no reason it should not work for you.

This is easier said than done. Implementing Predictive Analytics is not a trivial task. It’s not like you buy a piece of software from the Internet, install it on a laptop, and boom – you’re predicting the future. Although I have to admit that that is a good starting point. Implementing the initial infrastructure for PA does require meticulous planning. It’s a time-consuming effort, but at this point in time, a worthy effort.

Let’s take a look at high-level task list for this project

  1. Build the PA infrastructure
  2. Choose/build predictive model(s)
  3. Provision Data
  4. Predict!
  5. Ensure there’s company-wide adoption of the new predictive model. Make PA a key part of the organization’s operational framework. Ensure that folks in the company trust the predictive model and not try to override it with their human intelligence.

Steps 1 thru 4 are the easy bits. It’s the 5th step that requires a significant effort.

Most of us have relied on our superior intellect when it comes to making serious decisions. And most of us believe that such decision-making process yields the best decisions. It is hard for us to imagine that a few numbers and a simple algorithm would yield better decisions than those from the depths of our intellect.

However, it is important to change your organization’s mindset about predictive analytics. If you are considering your business to be consistently run on mathematical predictive models, acceptance from the user community is crucial. Implementing PA is a substantial effort in Organizational Change Management.

Remember the financial services industry. They don’t let their loan officers make spot decisions on the loan-eligibility of their clients based on their appearance, style of speech or any such human sensory cues. Although, if you ask the loan officer, they might claim to be better judges of character – the financial industry does not rely on their superior human intellect to measure the risk of loan default. Generally, a single 3-digit number makes that decision for them.

The next time you go to the supermarket for a loaf of bread, and return with a shopping cart full of merchandise that you serendipitously found on the way back from the bread aisle including the merchandise along the cash-counter, you can thank (or curse) the predictive analytics employed by the store headquarters located probably a thousand miles away from you.

AmickBrown.comGet What You Expect

4 Best Practices to make your Storyboards more Dynamic and Appealing

By Iver van de Zand  – Business Intelligence & Analytics – SAP – Visualization – DataViz – Evangelist – Author of “Passionate On Analytics”

Your end users will love it when you’d deliver your story- and dashboards in a more appealing and dynamic way. In these Let Me Guide series I discuss 4 easy to use best practices that will help you doing so:

  1. Using backgrounds

  2. Using Navigation

  3. dynamic Vector Diagram pictures: SVG

  4. Dynamic Text

Using Background

Backgrounds can better the looks and experience of story- and dashboards. Use the opacity to ensure the attention is not too much distracted from the actuals graphs and charts. I tends to create my backgrounds myself using PowerPoint: create a slide with a layout you like allocating space for KPI metrics and visualizations. Save the slide as JPG which you can import as background into SAP Lumira.

Using Navigation 

If you have story- or dashboards with multiple pages, my experience is that custom navigation buttons help you users finding what they should read. I use custom navigation all the time on my storyboard’s landing pages for example. Here is how you do it:

  •  Find a shape or picture that you want to use as clickable button and save it as xx.jpg

  • Import xx.jpg as picture in Lumira and drop it on your storyboard where you want it

  • Drag and drop a rectangle shape exactly over you newly created button and set its lines and fill-color both to “none”

  • Click you “invisible” shape and add the URL or page number to it

  • Save and preview

Example landing page B

example of navigation buttons

Example landing page A

Example landing page A

Example of a core layout of a landing page for your storyboard. The color-coded tiles can be used as navigation buttons. The generic tiles act to show key metrics info. Save the core lay-out as JPG and use this JPG as core background in your storyboard. Now add an object over the color coded sections, make it invisible and add a page-link to the appropriate page in your story.

SVG files

Especially infographics gain on weight and meaningfulness if you use dynamic pictures as part of your charts and graphs. Bar- and line charts in SAP Lumira have the possibility to change its regular column and markers into a dynamic pictogram. You can use the embedded pictograms but also add your own. The pictograms need to be in the SVG dynamic vector format. Search for pictures on Google with the “ filetype:SVG” string to find SVG’s. Save and import them to Lumira and change the graphs properties. The results are impressive. It is easy to create your own SVG files: I use PowerPoint to create my own pictures and save them to JPG. Using conversion tools easily creates an SVG that you can use as dynamic chart/graph picture in your storyboards.

Dynamic Text

Dynamic Text is a powerful way to improve context sensitive messaging in your story- and dashboards. The dynamic text is based on a dataset attributes and thus changes when data is refreshed are filtered. Since SAP Lumira handles the dynamic text as any other attribute, you can also apply formulas against the text.

Corporate Social Responsibility and Small Business

by Karen Gildea , Managing Partner , Amick Brown

Sustainability has been a recognized business strategy for the past decade or so.  Strategies to reduce the adverse impact that a corporation had the on the environment were the areas of focus.  Choices to invest in renewable resources, to institute recycling policies and reduce contributions to the pollution of our air and water were key.

Over the past 10 years the objective of sustainability has been shifting from a direct focus on environmental impact to a more far reaching objective that still includes environmental goals, but has also brought broader social concerns into focus as well.

In addition to environmental impact, companies are now paying attention to their employee’s and customer’s well-being and the well-being of the communities that they operate in.  Corporate Social Responsibility or CSR, has become a key business strategy for many global companies with 75% of them tracking and issuing CSR reports.  It is time for all responsible companies, big and small to get on board as well.

The Society for Human Resource Management (SHRM) defines Corporate Social Responsibility as “Recognition of the impact a corporation has on the lives of its stakeholders (including shareholders, employees, communities, customers, and suppliers) and the environment; can include corporate governance, corporate philanthropy, sustainability, and employee rights and workplace safety.”

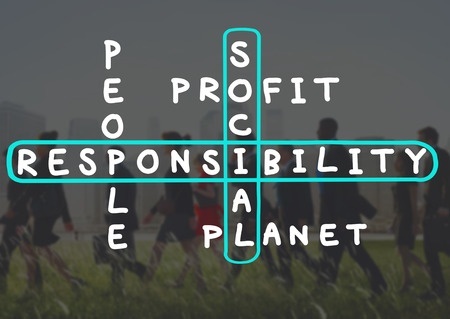
There is a generally recognized principle of the 3 P’s when considering Corporate Social Responsibility:

  • Profit (Economic) – a company must be profitable to be sustainable into the future. A profitable company produces products and services that provide benefit, they pay employees and purchase goods and services which is good for the economy.
  • Planet (Environmental) – a company should have a sustainability strategy to minimize its negative impact on the environment and expanding the use of renewable resources.
  • People (Social) – carrying for employees through pay and benefits, helping them achieve a work/life balance, providing growth opportunities and treating them fairly will make them more productive in the organization. This will create a more sustainable workforce.  A company should also expand its focus to its surrounding community, suppliers and customers – the goal of which is to create a sustainable customer base.

Andrew Savitz represents this concept most concisely in his book “The Triple Bottom Line ”“A sustainable corporation is one that creates profit for its shareholders while protecting the environment and improving the lives of those with whom it interacts.”

Companies do not need to be large corporations to pursue CSR objectives.  Small businesses can and should participate as well.  By including a focus on providing long term value in addition to the pursuit of growth and profits, businesses big and small can advance their CSR impact.

The best way to start is to begin thinking about it – document it as a business strategy.  Think about it in terms of the 3 P’s and start small and simple.  Some ideas:

  • Profit – this one need not be further addressed as it is already a primary objective
  • Planet – with a little thought and planning, small businesses can establish internal processes that support a sustainable environment – simple approaches include:
    • instituting recycling
    • consciously reducing energy usage
    • evaluating suppliers and goods purchased based on their sustainability efforts
  • People – evaluate internal HR policies and employee relations for improvement opportunities:
    • recognize the needs of the employees in balance with the needs of the business; (e.g., flexible work schedules, support training opportunities, etc.)
    • ensure labor compliant and non-discriminatory business practices
    • look for volunteer or charitable opportunities in the community

A move toward CSR does not need to have a negative financial impact on a small business.  There are things that can be done without added cost.  Give it some thought and start small.

Do well by doing good!

The Time to Change is Now

clock_calendar_moneyThe world is speeding ahead at a significant pace towards a major revolution—the data-driven economy.  Several data-driven start-ups in the last decade have become large corporations (Google, Facebook, Twitter), with billions of people reached and influenced by their innovations. Here is a list of the hottest start-ups that are looking to mature to the big league.

As the momentum is picking up, major organizations from different industry verticals are in a quest to exploit the opportunities that have arisen from the humongous amount of data that their business generates, directly and indirectly. Philip Evans, Senior Partner, Boston Consulting Group, discussed in his TED talk what businesses would look like in the future, and the impact that Big Data will have on business strategies.

Whether businesses want to use data to make the world a better place, to understand the wishes of customers before they’re expressed, to be more proactive than reactive in decision making based on predictive technologies, or something else, there are several challenges that we must all face.

These challenges include the following.

  1. Data volumes are ever-increasing. Most of the data is unstructured (either textual, videos, graphs and so on) rather than transactional and structured.
  2. The decision cycles are becoming shorter. We expect millisecond response times from the systems we interact with. And with mission-critical applications, the response time could be even shorter.
  3. Thousands of predictive models are required to get coverage of all the predictive scenarios that an application can create.
  4. Traditional methods of modelling are very time-consuming. The quest to find a perfect model drains valuable time and money before it can be put to business use.
  5. The knowledge workers who understand data science, and who could mine useful actionable nuggets from the data, are rare. The demand for such skilled workers is ever-increasing and their lack of availability is causing a massive skills gap.

With Challenges Comes Opportunities

However, with challenges come opportunities.

Consider the Industrial Revolution. As we know, at that point in history the move was to automate processes that were repetitive or required more manual effort, and find ways to free valuable resources—the brain and imagination—that we use to focus on even larger problems. The result is the modern world we now live in.

Now the data revolution is demanding a new change. That is, the way in which we work with data. We must find ways and means to automate most of the repetitive workflows and modelling processes that are applicable industry-wide. This way, we can free the very valuable time of the data scientist to focus on tough problems that cannot be solved without human intervention.

With several thousand models that enable a data-driven company to run, it’s also important to have capabilities that enable the company to monitor the performance of these models in real time. This means decommissioning the models that exhibit significant deviation in performance, as compared to when they were deployed on production systems.

This paves the way for the need of a Massive Predictive Factory, a single source of truth and heart-beat monitor for the entire organization.

For more on Predictive Analytics, Follow Amick Brown