All posts by Amick Brown

2016 and Business Analytics: Be Prepared for a Smashing Year: Part One

by Iver van de Zand, SAP

The end of the year is always a time to reflect, but also a time to look ahead and think about what might be different or innovating next year.three-spheres

Reflecting on 2015, three things immediately come to mind:

  1. Interactive self-service business intelligence (BI) has definitely landed and earned its permanent place. Every top-100 customer I talked to has self-service business intelligence in its BI strategy plans.
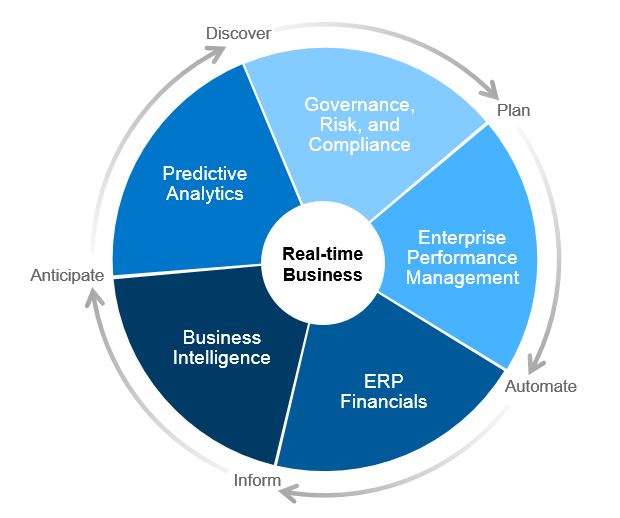
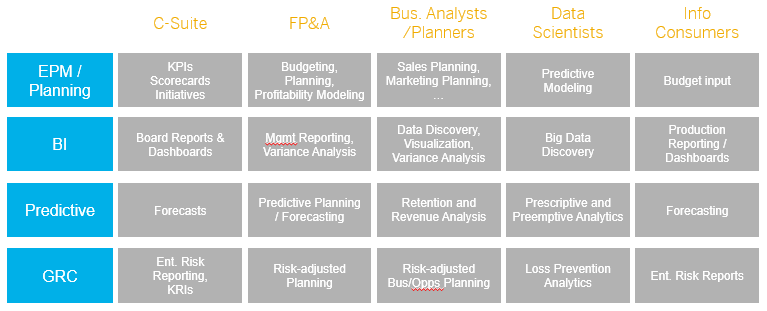
  2. “Traditional” business analytics (as in managed reporting and dash boarding) is not sufficient anymore for full performance management. A closed loop portfolio of analytical, predictive, planning, and GRC information is becoming a necessity in today’s management of processes and business flows.
  3. The value of in-memory platforms is now being recognized by leading companies. They massively adopt in-memory platforms to not only run their core applications, but also to integrate business data and facilitate analytics.

Looking forward, I’m sure you’ll agree with me that analytics is heavily influenced by the readiness of organizations to adapt to change resulting from the Digital Transformation. Connected economies and networks, data that’s available at any moment at any level, and sensor techniques allowing for new business models—they all heavily influence our needs for insights. As such, they heavily influence the 2016 trends for business analytics.

Did Tableau Lose Its Head?

Recently, I did the Google search exercise for “BI Trends 2016″and was both shocked and amazed. Our friends from Tableau’s marketing department have succeeded in monopolizing  80% of the first 20 hits! However, if you read closely, you’ll notice they are all referring to the exact same article. (Though they all seem to be different articles, they all cover identical things.)

I was further shocked  by the lack of insights these identical articles cover.  My feeling is that the articles point out  BI trends for 2014 (or earlier). “Governance and self-service become best friends,” it says. Dear people from Tableau, self-service BI can only exist by the sake of data governance. If self-service BI is not governed properly, there is no sense for it. And the trend mentioned as “Data Integration gets Exciting”? This was something everybody focused upon in 2012.

Analytical Projections for 2016

So what can we expect for 2016? Personally, I can only reflect on what I see and hear when talking analytics with key customers every single day. For me, these discussions have provided food for thought. Listening to the plans that my customers have, I can extract five key trends for business analytics in 2016:

  1. Self-service BI will become a commodity
  2. Business will embrace the portfolio loop
  3. Companies will really analyze Big Data
  4. Cloud BI adoption will accelerate
  5. Operational BI footprint will grow

Let’s take a closer look at the first two trends in today’s blog.

  1. Self-Service BI Becomes Commodity

Governed self-service BI will further find its way to all echelons of organizations. And the reason is simple— business users finally have the opportunity to drive analytics in their organizations. While 2015 was the year of adopting self-service BI, 2016 will be the year of the massive roll-out. Self-service BI is becoming a commodity in 2016 with the number of business users growing rapidly. From a functional perspective, the success of self-service BI is greatly determined by its ability to:

●  Interact with the user. Self-service BI can be adopted quickly because end users are able to interact with massive amounts of structured and unstructured sources of information.

●  Make data and insights easily visible. Business users really recognize the value of making insights visible. The simple but clever idea of using visualizations and analyses to create your own stories (storytelling and infographics) is very successful. Nice examples are GEO-driven stories, dashboards , and D3 open- source visualizations. These, combined  with interactivity, make self-service BI a stunning combo. As I’ve mentioned before,  “our meetings will never be the same.” We can now use interactive, visualized insights to discuss and monitor the heartbeat of our company in real time!

●  Be agile with new and ever-changing data. A third success factor (what’s in a name J) to self-service BI is its agility. This agility is a huge value-add because it allows business users to really simply acquire and enrich new data and use it for analyses. Bear in mind, this also applies to Big Data using in-memory computing.

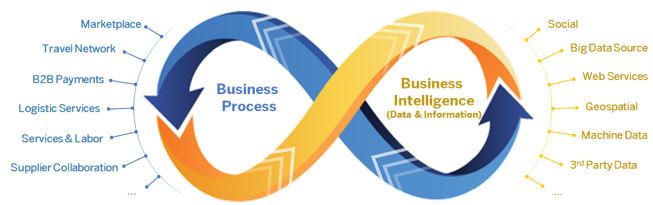
  1. Business Embraces the Portfolio LoopReal-time business wheel

I’ve made my point on the importance of the closed loop portfolio in earlier blogs. Every key customer I met last year who’s willing to embrace Digital Transformation is seeking an integrated and governed platform to analyze, plan, predict, and assess risks in a constant and permanent loop.

I use the word ‘integrated’ on purpose here, since here is where the difference is made—customers seek to have real-time integration between their business analytics, their detailed planning, and the predictive models that affect, for example, product mix or pricing strategy. The integration also needs to be on operational financials and towards risks and compliancy cases when needed.

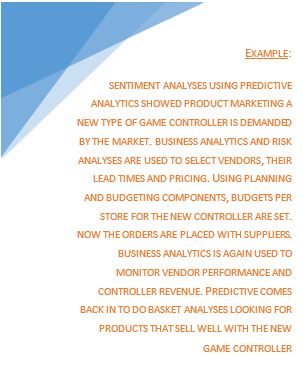
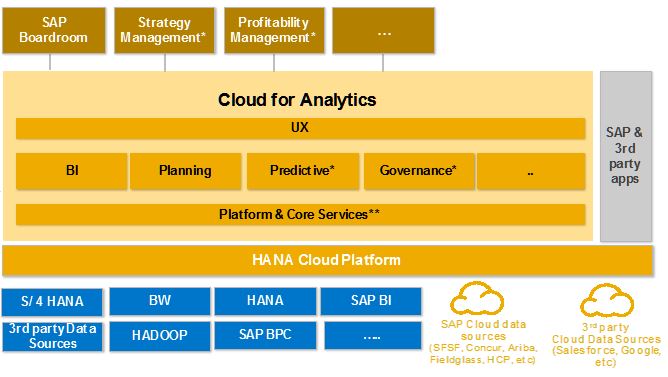
Many of my customers have accomplished this on a near-integrated level that isn’t real time by using individual components that access each other’s data. Products like SAP Cloud for Analytics are revolutionary here since they provide the closed loop portfolio covering real-time, interactive integration on all mentioned areas. Markets have been waiting for this for quite some time and are eager to adopt. It allows them to interact with market fluctuations that speed up due to the Digital Transformation. You can look at the examples I described in a previous blog for the retailing sector to understand the scope of the closed loop portfolio.

Stay tuned for my next blog. I’ll discuss the other three trends I see for business analytics in 2016: analyzing Big Data, the acceleration of cloud BI, and  the growth of operational BI.

Follow me on Twitter @IverVandeZand.

Amick Brown is here for you.


What is Design Thinking?

Contributed by Kaan Turnali, SAP
“Customer-centric design is about looking out from the inside—rather than outside in”

Today’s organizations face multifaceted problems that are part of increasingly complex business models. Continued expansion of global transactions, supported by partnerships that can span large ecosystems, create unique opportunities and unique challenges for businesses.

These challenges demand multidimensional solutions and require more than just basic applications of current products and services. This is where design thinking comes into play. By applying this framework, organizations can not only address everyday business problems and challenges but also gain a competitive edge.

To stay relevant, companies must innovate without disruption to drive growth and profitability. As Tim Brown, CEO of the design and innovation firm IDEO, puts it in a Forbes.com interview, “Design thinking is all about upgrading within constraints.”

What-Is-Design-Thinking

What Is Design Thinking
In its simplest form, design thinking is a process—applicable to all walks of life—of creating new and innovative ideas and solving problems. It is not limited to a specific industry or area of expertise.

It can be as effective in technology or education as it may be in services or manufacturing. It could result in new products and services for customers or improved processes and productivity gains for internal operations. If applied with equal fervor, it can even transform HR, finance, marketing, or operations teams—turning them into lean and agile profit centers.

The award-winning documentary Design & Thinking explores this idea and provides perspectives by well-known subject-matter experts in this space. The Hasso-Plattner-Institute (HPI) at the University of Potsdam School of Design Thinking, in Germany and the Hasso-Plattner-Institute of Design at Stanford University in California are the two leading educational institutions in this field.

Developed by IDEO founder David Kelley, design thinking is defined as “a human-centered approach to innovation that draws from the designer’s toolkit to integrate the needs of people, the possibilities of technology, and the requirements for business success.” Thus, the method focuses on three main elements of a product or solution: people, technology, and business. All of these aspects evolve around the customer.

The customer drives the current and future state of any business. Products and services, whether they are delivered to internal or external customers, must create intrinsic value and address specific business needs. This cannot be done unless the customer is an integral part of the entire product lifecycle—not an afterthought.

It is accepted that businesses, projects, or teams that lack customer focus are bound to fail. Design thinking makes the customer the main focal point of design for any solution. Plus, it consistently applies the values embraced by this approach, such as empathy, diversity, and ambiguity, as well as recognizing the importance of multidisciplinary teams. Many of these principles reflect ideas that stem from well-known principles and/or best practices. However, design thinking, in essence, incorporates them into a coherent and repeatable process.

Here are my interpretations of some of these principles. You can find others listed here.

  • Success comes from designing integrated solutions in which each part completes the system in whole—not designing fragmented pieces that make up a stack.
  • By getting closer to current or potential users and going beyond distant observation, we have a chance to design by looking out from the inside—rather than outside in.
  • Empathy opens up nerve endings so we can feel what it is like to be in another’s shoes—a prerequisite for customer-centric design. We need to get as frustrated as the users/customers so we can better understand the pain points.
  • By bringing multidisciplinary teams together at the table, we leverage the power of collective expertise.
  • Embracing ambiguity opens the door for human ingenuity—allowing us to chase opportunities for new ideas we would otherwise miss.
  • Promoting the philosophy of “fail early and often” is the key to harnessing the power of rapid prototypes and delivering proof of concepts that resonate and encourage feedback from actual users and customers.

This last one is the closest to my heart because it often reminds me of two famous quotes (available in several variations on the Web). First, there is Edison’s quote about failure and inventing the light bulb: “I have not failed, not once. I’ve discovered ten thousand ways that don’t work.” Then there is Frank Lloyd Wright’s insight “You can use an eraser on the drafting table or a sledgehammer on the construction site.”

To me, design thinking is a framework for ingenuity. It can generate excitement for new ideas, leading to solutions that address unmet needs. Just as business intelligence can be the enabler for faster, better-informed decisions, design thinking can be the driver for better-designed solutions for products and services.

I always argue that passion is the fire that ignites engagement by inspiring what is possible. In the context of business and technology, ideas create the demand for technology that can translate into solutions that drive growth and profitability.

Connect with me on Twitter (@KaanTurnali), LinkedIn and turnali.com

The Overwhelming Power of Analytics in Retailing and B2C: Part 2

Businessman Analyzing Graph


Contributed by  Iver van de Zand, SAP

Retailing and business-to-consumer (B2C) market requirements for online insights are relying heavily on the closed-loop portfolio. The permanent and online interaction of analytics towards rolling planning or predictive models applies all the time. As a follow up to Part One, today I’ll discuss the various ways analytics is applied in retailing and B2C. The situations below are far from exhaustive, but at least they provide insights into what I’ve experienced in various engagements with the retailing sector.

Retailing and B2C segments rely on real-time availability of data insights. Customer behavior, societal influences, the distribution column—they all fluctuate drastically and affect commercial behavior so intensely, that only real-time insights empower the retailer to monitor and adjust the closed loop portfolio. Needless to say, retailing and B2C require in-memory platforms, which provide the calculation and data handling power, plus the scalability, that are needed so badly.

At the base of getting insights are in-memory systems that track every single transaction done in the shops or online. An often-seen solution for this is called SAP Customer Activity Repository (CAR). SAP Customer Activity Repository is a foundation that collects transactional data that was previously spread over multiple independent applications in diverse formats.

Watch the SAP Customer Activity repository video HERE

The repository provides a common foundation and a harmonized, multichannel-transaction data model for all-consuming applications. Retailers can use SAP Customer Activity Repository to gradually transform their system landscapes from traditional database technology to the revolutionary, in-memory database technology.

Assuming the real-time platform and SAP Customer Activity Repository are available, what is the typical scope for this market segment’s insights using analytical components from the closed loop? Let’s have a look.

Basket Analyses

Basket analyses are the core insights that provide information about what people buy at what moment and at what location. We get insights into what is in their “basket.” The mix of products consumers buy is especially interesting. For example, a retailer can use real-time predictive models to predict whether a young female teenager buying red trousers might also be interested in purchasing accompanying earrings.

Sensor techniques can really help the shop employees to focus their advice specifically to the customer’s needs. Consider this shopping scenario:

  • Sensors inform an employee that a customer is picking a blue shirt, sized XXL from the rack.
  • Online analytics and predictive models immediately tell the employee on a mobile device that the customer took the wrong size (based on his buying history) from the rack.
  • The buying history then indicates that the customer typically buys three pieces at once.
  • The employee is also informed that the customer’s profile indicates he might be interested in buying jeans to go with the shirt he’s looking at (based on predictive models).
  • Finally, loyalty card information indicates that if the customer today buys four pieces, an extra bonus will be provided to his savings card.

All this information helps the employee interact with and sell to the customer.

Shop Performance

With shop performance, I mean the ability to use real-time, closed-loop analytics on anShop Performance
overseeing shop level. Sentiment analysis based on, for example, an impacting television show last evening where a popular boy’s band showed their new, hip-colored sneakers, might trigger the retailing group to discount a second article when customers buy similar sneakers. The agility here is crucial—sentiments are notified from social media analyses and action needs to be taken immediately.

Local influences could mean specific sizes of a product are sold very well in one place, but less well in other places. This might trigger shop management to re-allocate stock to other shops. The same thing applies to ranking capabilities—permanently monitoring top-bottom rankings per article, color-item or size is valuable, since the slightest social change (a big event in one specific city) might cause immediate changes in buying behavior locally.
Metrics

Customer Loyalty

Customer loyalty cards provide the retailer with a wealth of information if used well. The loyalty cards “identify” the person buying. We can see the consumers’ buying behavior, what they buy, and when. Tracking techniques (picking up  mobile devices’ signals when customers enter the store) show us in real time exactly where each customer spends their time in our shop, what is the route that customer typically follows, and what is their average visiting time.Retail

Retailers can go a step further by combining loyalty card information with the customer’s buying history and social media information. This further completes one profile, allowing the retailer to tailor make marketing initiatives on an individual level.

For example, I—as  customer X—might receive a special offer for a new external hard drive from a retailer, since combining data shows that I like audiophile equipment, buy music magazines (basket analyses) and spend quite some time at the electronics department when visiting that shop. The data insight is that I might need (or want) a storage device to store my music.

Customer loyalty cards might also bring great value to the customer retention program. Customers nowadays really quickly change their providers of goods because they are  enormously well informed.

Visitor Analysis


Weather Influences

Weather conditions greatly impact the buying behavior of customers. In general, windy weather has proven to have a highly negative impact on retail sales revenue. Making other general statements is difficult since a specific weather condition can have a positive effect on one type of retail, and a negative on another. Think about how cold weather might improve sales of books but negatively affect sales of handbags, for example. (A nice article focusing on the impact of temperature on shopping can be found at the Summit Blog.)

Likewise, a retail shop’s location—inbound or outbound—and its availability of underground parking are very important in rainy conditions. For retailers, it’s important  to realize that weather conditions have so much impact that they can’t be excluded from operational insights on shop performance. Thus, they must make them part of the closed loop portfolio.

Alternative Business Models

Retail and B2C markets are probably one of the most highly interesting market segments to follow. Why? Well, they’ll be under great change. The “Digital Transformation” age and the availability of information to both the retailer and the consumer are changing everything.

Consumers are not only wanting to know “everything” about their product, they are also shifting to buying (or should I say “renting”) a product experience rather than the product itself. For the latter, think about the accompanying services to a product that the retailer might want to offer. Have a look at this article from Forbes, which describes three trends for retail in the future—instant gratification, borrowing, and customization.

For me, there is enough food for thought to write a Part Three of the series on the overwhelming power of analytics within retailing and B2C. Stay tuned.

Follow me on Twitter – @IvervandeZand.

– See more at: http://blogs.sap.com/analytics/2016/01/06/the-overwhelming-power-of-analytics-in-retailing-and-b2c-part-two/#sthash.YIdYhjL9.dpuf

The Overwhelming Power of Analytics in Retailing and B2C: Part One

Women With Shopping Bags --- Image by © Tim Pannell/Corbis
Women With Shopping Bags — Image by © Tim Pannell/Corbis

Thank you to Iver van de Zand, SAP

Online grocery shopping and personalized bonus cards – we all face these incentives every day. Each is strongly driven by the overwhelming power of the analytics that are behind them. This article will share my experiences on these topics providing examples of retailing and B2C customer journeys that I have been a part of. The below examples are not at all exhaustive; they are also not about the future but are what happens, and are in production, today!

One thing that makes the retail market segment so interesting is the extreme sensitivity to community influences. A small thing might happen in society that can immediately affect buying behavior: today people are connected everywhere and at any moment. A simple anecdote on social media is shared so quickly that it can influence consumer choices instantly. One simple bad review about, for example, a yogurt brand, can raise or lower the selling of this product the next day. If the retailer wants to act upon these influences, he needs state of art Insights and online operational analytics.

Retailers are Analyzing You

Your bonus card, combined with your social media credentials, tell the retailer a whole lot more about you than you might realize. Analytics, clustering, and predictive modeling inform the retailer about your family composition, your eating and clothing preferences, how many children and pets you probably have and even what kind of holidays you like. By smartly combining your information with reference groups, the amount of trustworthy information a retailer can predict is huge.

Now imagine that the retailer recognizes you based on your cellphone signal when you enter the store. This information is linked online to your bonus card and social media credentials: “the retailer knows exactly who is in the store”. Then based on the same cellphone signal, the retailer can follow (!) you through the store using GEO coordinates. It means the retailer knows you are in front of the vegetable section, and also knows – based on the bonus card info – that you like carrots a lot. The electronic banner automatically flips and messages about a special offer on “carrots that taste very good with a new white wine that you might want to try”. A message targeted at you.

Imagine?? Well, forget about “imagine” – this is done today and you are part of it.

Supply Chain Challenges

Imagine this scenario. The latest game controllers are very popular, so our retailer decides to order additional stock from one of his vendors. Using buying behavior and predictive algorithms, the retailer knows he will sell the controllers. Early in the morning the stock manager receives a message that the vendor’s truck driver is stuck at the border and will be very late. Order intake quickly searches for alternative vendors and places an online order. That order will influence consumer prices and using business analytics the retailer can immediately predict the effect this price change will have on today’s revenue. It also automatically adjusts the retailer’s forecast and rolling plan, even from its subsidiaries if they exist. Using basket analyses, the new type of game controller might be influential to the selling of USB cables too so the retailer decides to order additional USB sticks and the system automatically adjusts distributed forecasts and rolling planning. Imagine? Not at all!

Product OffersMan holding gift bags --- Image by © Ocean/Corbis

Apart from understanding the buying behavior of a customer (using bonus cards and others), retailers spend a huge amount of effort in understanding where the demand will be. Trend forecast algorithms combine social media posts, web browsing behavior, and ad-buying data to predict what will cause a trend or buzz. Social media discussions on the clothing habits of a popular band might cause specific trousers to become popular. These sentiment analyses get even more complex if you realize that there is a heavy demographic component embedded together with economic indicators. Offerings on detective books will increase significantly if two things occur – the weather gets colder and at the same time a significant crime is discussed on social media.

In-Memory Computing and Interactive Insights Make the Difference

Retailers and B2Cs in today’s market dynamically follow and influence customer buying behavior. They have to because the consumer is so well informed and has so many alternatives for buying. Retailers have to act instantly on changing behavior. To do so the amount and complexity of information that needs to be analyzed is so big, only in-memory computing can handle it. Bear in mind that an individual retailer is never on its own but part of a brand, meaning individual shop performance is rolled-up to the corporate level. This corporate level manages online shop performance indicators, compares the various stores, and delegates rolling budgets down to the shops on a daily basis. These budgets vary daily given the changing demand analyses we talked about above.

These dynamics also require online interactive analytical capabilities. Information on buying and demand behavior varies daily and is analyzed permanently. Ever changing sources, unknown structures of new information, or simulation models require the analyst to interact with the data all the time.

In a future article, we will deep dive into some of the other use cases for business analytics in Retailing and B2C market spaces. One of them is basket analysis. Using predictive modeling combined with business analytics, it’s possible online to utilize the buying behavior of the consumer. These are techniques that are used today! Looking forward to share with you

– See more at: http://blogs.sap.com/analytics/2015/12/09/the-overwhelming-power-of-analytics-in-retailing-and-b2c-part-one/#sthash.ozusXrxq.dpuf

Placing short and long term Resources based on Cultural Match

The Importance of Cultural Due Diligence

emotion guy


We have all been there. You are a few months in to a new job and something is just not perfect. The work itself is on target, challenging, fulfilling, and not too many surprises. Your colleagues are professional and friendly, but you are floundering around still to find your comfort zone. It is likely that cultural fit is imbalanced between you and your new company.

In the fairly recent past, corporate culture has evolved from the scenario of if you were in business the dark suit went on in the morning, arrived at your cubicle, and preserved the time-honored tradition of being a staunch professional. Now, companies take on all sorts of personalities, expectations, and cultures which range from the still staunch professionals in dark suits and cubicles to bean bags, mandatory relaxation breaks, and shorts/jeans/tshirts as office attire.

The bottom line is that they are all correct! How a company excels in business is driven by their beliefs and success stories. It has become a critical step to not only evaluate skill requirements, but also intimately understand the cultural aspect of a new business.

Organizational culture evolves over time based on attitudes, customs and values that make up a company’s unique social and psychological environment. An organization’s culture touches all aspects of the business and it is expressed in its products, the way it interacts with it employees, customers and the rest of the world. Certainly, it will impact the new employee directly. The subtleties of culture are definitely something that can be sought out and matched to candidates with due diligence.

What is a fit for one candidate may not be suitable for another. You can teach an employee new skills but is hard to train for cultural fit if they don’t fit the mold. When there is a cultural fit, the person will naturally perform consistent with how things are done in an organization. It results in employees being engaged and focused on growth and the organization reaps the benefits. As well, the employee reaps the benefit of loving their job, not only for the skill and professional challenge, but because it is where they thrive psychologically. The opposite is true when there is a cultural mismatch. Studies show that cultural fit positively impacts performance, ability to adopt to changes and retention.

The same principles apply to staff augmentation decisions. It is exceptionally successful to take the culture fit analysis step when hiring contractors. At Amick Brown, we have built our successes on the practice of not only understanding our clients’ cultures, but staying involved after the placement with both the company and the contractor. Ongoing team building puts everyone in a position of positive communication and therefore reduces churn.

diverse people globe

Amick Brown’s IT sourcing strategy in recruiting and staffing projects is to ensure that, apart from technical skills, there is a cultural fit both for the customer and the consultant. Our proprietary methodology incorporates thoroughly understanding the client’s cultural personality. We take into consideration the leadership and the communication style of the client’s team. At times the role that we are staffing might need a heavier emphasis on technical skills vs cultural fit. We are realistic about both the positive and negative aspects of the culture and balance our recruiting strategy for each client. We are aware of the need to strike a balance between technical and cultural fit in IT recruiting. We are proud to say that this has helped us to achieve more than 95% consultant retention with our clients. Cultural due diligence in hiring and staff augmentation makes a big difference!

The Closed Loop portfolio in Analytics

The Closed Loop portfolio in Analytics

Authored by Iver van de Zand, SAP

We talked about the overwhelming power of analytics in Retail and B2C market-segments earlier and one of the topics discussed there, was the integration of operational business activities with operational analytics. In the example we saw the stock manager using analytics to change his stock-buying-behavior. He adjusted his order system by choosing another vendor and placing the order. Immediately his analytics are updated and he now requires to adjust his rolling planning or run a predictive simulation how the price-adjustment of his new stock might affect buying behavior of his customers. He might even want to adjust the governance rules with his new supplier or run a risk-assessment.


Below pictures visualizes the continuous integration of core business activities with business analytics, indicating examples of core processes with their accompanying analytical perspectives. These are just examples and not exhaustive at all.


Performance Management closed loop

Basically what the stock manager in our example needs, is a full – real-time – integration of business analytics with his core business activities over all aspects of his performance management domain. A predictive simulation of changing buying behavior lead to new analytical insights on product mix which might influence the companies’ budget and causes a risk analysis for new vendors.

To do so, a closed loop is required of following core components driven by the continuous flow of Discover – Plan – Inform – Anticipate:

  • online Analytics on big data with interactive user involvement
  • ability to adjust and monitor a rolling Planning for budgets, forecasts. A planning that that allows for delegation and distribution from corporate level into lower levels
  • GRC software to perform risk analyses on for example vendors or suppliers
  • online Predictive analyses components to apply predictive models like decision trees, forecasting models or other R algorithms. Predictive analyses allow to look for patterns in the data that “regular” analytics is not able to discover. The scope of predictive analytics is gigantic: think not only sentiment analyses for social media, but also basket analyses in retail markets, attrition rates in HR and many, many more.


This so-called closed loop of predictive analytics, planning and performance management, business analytics and GRC is NOT a sequential process at all. They interact randomly towards each other in real-time and at any moment needed. They are also dependent towards each other, since Digital Transformation requires us to be so agile, we have to constantly execute and collaborate on the interoperability of the components and monitor the outcome. Lastly, the closed loop platform interacts on core operational activities (real-time insights in operational data) and as such the analytics are defined as Operational Analytics.

Closed loop platforms more than anything else require business users to drive its content and purpose. They drive the agility to the platform that is so heavily needed in the Digital Transformation era. On the other hand the technical driven architects do make a difference too, since closed loop platforms are very sensitive to respect governance principles. A special role is allocated to the CFO or Office of Finance here; they will drive the bigger part of the Planning and Budgeting cycle.

One can imagine the calculation processes behind the closed loop platform are huge and therefor a business case for an in-memory system is a sine qua non.

Imagine the possibilities

Needless to say that the closed loop model applies to all industries and not only in the retail example that I used here. I can list plenty of examples here but just to name a few:


  • HR: attrition rates of employees
  • Banking & Insurance: customer segmentation, product basket analyses
  • Telco & Communications: churn and market segmentation nut also network utilization
  • Public Government: Fraud detection and  Risk-Mitigation
  • Hospital: personalized healthcare

Apart from imagining the possibilities per market segment, we can also change perspectives and look at the possibilities per role within companies applying the closed loop platform. Below picture provides capabilities the closed loop components could offer to various user communities. The potential is huge and extremely powerful when used in an integrated platform. This is also the weaker point of the closed loop platform: the components must be integrated not to miss their leveraging effect on each other.

A solution is available today

With its Cloud for Analytics offering, SAP is today the only provider with an integrated offering for the closed loop platform. Even more: SAP Cloud for Analytics is integrated in one tool offering analytics, planning, GRC and predictive capabilities. One tool?? …. Yes, one tool completely Cloud driven and utilizing the in-memory HANA Cloud Platform it is running on. One tool that seamlessly lets analytics and planning interact with each other. A tool where you can run your predictive models and analyses and visualize the outcome with the analytics section. A tool that allows access to both your on premise data, your Cloud data and/or Hadoop stored data. And lastly a tool with fully embedded collaboration techniques to share your insights with colleagues but also involve them with planning or others.  Our dream becomes reality.


Data Driven Decisions improve your business

Fact Based Decision Making

For many companies the first reporting and analytics question that they ask is, “What specific items should my company measure?” However, what you measure should be based on how to get results from your data that make measurable change in the organization. The first question really is, “What are my business goals and what measurable components can help me achieve or miss this goal?

Decision Man

Some examples are:

  1. Churn reduction
  2. Retirement possibilities in the next year.
  3. Employees that leave in less than a year
  4. Departments with the highest attrition
  5. Supply chain service improvement
  6. JIT miscalculations by department or location
  7. Customer service complaints, late deliveries to customers
  8. Staffing variations and what affect this has on production 

Why fact based is important…

Another huge common occurrence in the reporting world is decisions made without trackable, measureable fact. Unbelievably, companies still make decisions with historical process, experience, and their “gut” to some degree.

With the availability of big data, your competitors are not only going to have access to information about themselves, but also about your customers and your ability to perform. If this data is not used well by your company – you will lose business.

So how exactly does your company aggregate data, produce reports, or glean insight to meet goals? If you are like the vast majority of companies out there, it is a big data dump into a spreadsheet that is picked through and interpreted by the individual who requested it.

Many have very slick Reporting solutions, but they are not leveraging them to the full potential – not by a long shot. Why is this? The pervasive gaps are that people are creatures of habit and continue to want to report like they have always done and change management/training is not factored in. The poor IT Manager put in charge of the BI project is inundated with data dump requests and help requests on-going.

Circling back to Data Driven Decisions, the very first things that must be carefully and completely determined are:

  1. What are the challenges that prevent me/my company from beating the competition, increasing revenue, operating smoothly, etc?
  2. What people drive the resolution of these challenges?
  3. What data and report metrics do these users need to show the golden road to overcoming the challenges?

Beginning with what decisions need to be made, which people will drive goal attainment, then what data and metrics will roll up to an answer – the first big hurdle to Business Intelligence success will have been overcome.

For more on this subject, watch this space… blogs.amickbrown.com/ 


Top Three Hurdles to Successful Reporting and Analytics

This is a first conversation based on what I am hearing in the market. There will be more to come, and I want your thoughts please. Let’s make a difference. 

Top Three Hurdles to Successful Reporting and Analytics

The challenge of useful, powerful, and appreciated Business Intelligence is felt across industries, departments, and roles. By using BI well, you will position yourself to beat your competition. If you do not use the data available to drive business decisions and goal attainment, you position your competitors to win – because they ARE leveraging their data.

What is the definition of successful Business Intelligence?

My best practices definition is “Success is measured by the ability of the right people, to use the right data, and create usable reports that aid in business goal attainment”.

Sounds simple, right? Well it will be with planning, understanding and buy-in from users at all levels. It is truly a change management issue as well as a technology issue. IT will drive the technology side, but must work hand in hand with the various business leaders to develop outcomes that make a difference in efficiency, process, and profitability.

The Top 3 Hurdles to BI Success:

  1. “Give me all of the data and I will figure out what I need”

Users, Managers, and Executives do not realize the depth of business case resolution that their data can provide. The approach tends to be, “give me all of the data and I will figure out what I need and want to use.” Inherently, this is manufacturing the outcome instead of letting it manifest organically.

Tied closely to this request is the real situation that people do not like change. They “have always done it this way” is a first cousin to the data dump method. Overcoming a historic process can be harder than learning how to use BI well.

With the powerful BI tools available, dashboards and reports can be targeted to achieve business success. These successes will be defined by each leader based on corporate goals. The tough part comes in taking a measurable goal and allowing the solution to mine the data from various sources to provide accurate reports from which to make decisions. Long story short – is the report authentic and actionable.

  1. “My data is a mess ! “

How many times have I heard that reporting and analytics is a moot point because the data flowing in has not been cleansed or integrated in years. Well then, we know where to start because this statement is true. Garbage in is garbage out.

So, this hurdle to BI success becomes part of the solution. Regardless of how simple the reporting and analytics outputs are, their foundation must be in valid data.

Housekeeping is essential – so the longer cleaning the house is put off, the dirtier it will get.

  1. One and done is not an option

Let’s look at a very common situation: When the shiny new “box” of BI software came – the enthusiasm was real. Users throughout the company were vested and interested in the cool reports that they would be able to generate. Well, that was 8 years ago. Hopefully much has changed in your business since then. The reports, however, have not changed. You are measuring and dwelling on 8 year old business challenges. This is definitely not effective.

A proactive sustainability plan will separate the average performing BI users from the rock stars. Incorporate this into your reporting and analytics plan!

YES – THIS IS PURPOSELY REPEATED – IT’S IMPORTANT

This is a first conversation based on what I am hearing in the market. There will be more to come, and I want your thoughts please.

 The challenge of useful, powerful, and appreciated Business Intelligence is felt across industries, departments, and roles. By using BI well, you will position yourself to beat your competition. If you do not use the data available to drive business decisions and goal attainment, you position your competitors to win – because they ARE leveraging Big Data.