Category Archives: Analytics

If the right people do not have the data they need, how can the intelligence be accurate?

By Ashith Bolar ,  Partner and Director AmBr Data Labs

Lack of user-acceptance is considered a failure of any new Information System — a rule that equally applies to a Business Intelligence initiative. And the astounding fact is that this is a very common occurrence. The reasons can be varied, such as the quality of data, the usefulness of the analytics provided by the system, or merely the user-interface being unfriendly.

However, what is not considered in assessing the success or failure of the system is the number of users who did not get access the system — an error of omission (pun intended). Typical IT projects finalize the initial set of end-users right at the inception of the project, and no later than the requirements phase. To manage the scope of the project, it is typical to keep a small and manageable initial user-base. However, I believe that this is a mistake!

I believe it is a mistake, that in trying to ensure the success of the project, the scope of the BI deployment should be restricted to a few. The true value of a BI enterprise is the crowd-sourced intelligence that you derive from it — and by this assertion: the more the merrier! Not only will a wider audience give us a better assessment of the success of our BI initiative, it will also ensure wider and quicker post-deployment enhancements.

Starting with a large audience of users has many challenges, least of which is managing the scope of the BI project. Given that a data warehouse typically contains sensitive data, one of the main concerns of a large user-base is data security — ensuring that only the right users get access to the right data. This concern leads to the usual decision of limiting the initial user-base to just the power-users, ones that require none or minimal data security.

pocker chips and aces

We see your challenge and raise you AccessOne©!

AccessOne is an information security software specifically designed for SAP™ Business Warehouse (SAP-BW). AccessOne allows you to build your access-control security in an easy excel-like matrix, and deploy it with a few clicks.  AccessOne can extract access information from your ECC system (be it role-based, structural authorizations, etc) or a traditional SoD ACL matrix, or even an excel file you created on your desktop. 

So that you can visualize AccessOne more completely–

A BI solution’s data security implementation is quite different from an OLTP system, even though they both try to achieve the same goal by means of a same set of parameters. The OLAP authorization mechanism works in the reverse direction of the procedures employed by an OLTP system.

See schematic below:

Take an example of an OLTP HR system / employee database. Here’s the sequence of events that occur when a user interacts with the system:

A1 1

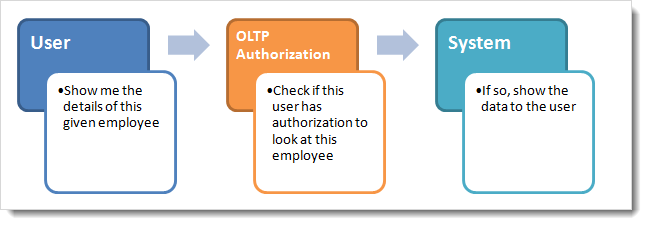
Now consider its BI counterpart. The typical user request sequence goes something like this:

A1 2

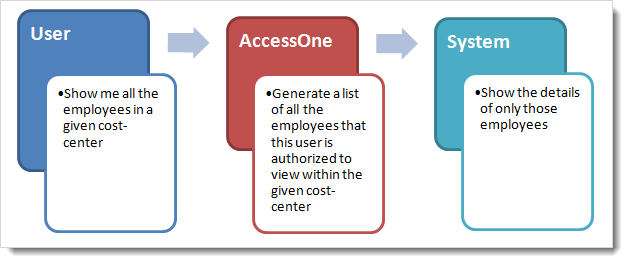
Although, this is a simplified view, it’s easy to visualize the change in the mechanics of how authorization works between an OLTP and an OLAP system.

The power of AccessOne is in its ability to transform security parameters from the data structures that are designed for an OLTP system to the ones that are more suitable for an OLAP system. Moreover, AccessOne applies these authorization checks to any and all users of the SAP BI system. It will replicate your OLTP (ECC) system access parameters (role-based, structural, etc) into OLAP (SAP BW) system access parameters (analysis authorization). 

With this power, and with the guarantee that your BI system access is exactly the same as your ECC, you can now open up your BI system to all the ECC system users, be it power users, domain-specific users, supervisors, or individual-contributors.

Another power of AccessOne is “overriding” or “overloading” authorizations derived from OLTP. With a single access-control entry, you can override or overload (add to) the access of any user or user-group. For instance, if you have an end-user with limited access in the Finance ECC system, however you want to provide this user with extended access to the BW system on the finance cubes, this can be achieved by inserting a single access-control entry in the BI system.

In the following blog posts, we will examine some complicated yet typical case-studies to illustrate the power of AccessOne.

– Watch this Space –


2016 and Business Analytics: Be Prepared for a Smashing Year: Part One

by Iver van de Zand, SAP

The end of the year is always a time to reflect, but also a time to look ahead and think about what might be different or innovating next year.three-spheres

Reflecting on 2015, three things immediately come to mind:

  1. Interactive self-service business intelligence (BI) has definitely landed and earned its permanent place. Every top-100 customer I talked to has self-service business intelligence in its BI strategy plans.
  2. “Traditional” business analytics (as in managed reporting and dash boarding) is not sufficient anymore for full performance management. A closed loop portfolio of analytical, predictive, planning, and GRC information is becoming a necessity in today’s management of processes and business flows.
  3. The value of in-memory platforms is now being recognized by leading companies. They massively adopt in-memory platforms to not only run their core applications, but also to integrate business data and facilitate analytics.

Looking forward, I’m sure you’ll agree with me that analytics is heavily influenced by the readiness of organizations to adapt to change resulting from the Digital Transformation. Connected economies and networks, data that’s available at any moment at any level, and sensor techniques allowing for new business models—they all heavily influence our needs for insights. As such, they heavily influence the 2016 trends for business analytics.

Did Tableau Lose Its Head?

Recently, I did the Google search exercise for “BI Trends 2016″and was both shocked and amazed. Our friends from Tableau’s marketing department have succeeded in monopolizing  80% of the first 20 hits! However, if you read closely, you’ll notice they are all referring to the exact same article. (Though they all seem to be different articles, they all cover identical things.)

I was further shocked  by the lack of insights these identical articles cover.  My feeling is that the articles point out  BI trends for 2014 (or earlier). “Governance and self-service become best friends,” it says. Dear people from Tableau, self-service BI can only exist by the sake of data governance. If self-service BI is not governed properly, there is no sense for it. And the trend mentioned as “Data Integration gets Exciting”? This was something everybody focused upon in 2012.

Analytical Projections for 2016

So what can we expect for 2016? Personally, I can only reflect on what I see and hear when talking analytics with key customers every single day. For me, these discussions have provided food for thought. Listening to the plans that my customers have, I can extract five key trends for business analytics in 2016:

  1. Self-service BI will become a commodity
  2. Business will embrace the portfolio loop
  3. Companies will really analyze Big Data
  4. Cloud BI adoption will accelerate
  5. Operational BI footprint will grow

Let’s take a closer look at the first two trends in today’s blog.

  1. Self-Service BI Becomes Commodity

Governed self-service BI will further find its way to all echelons of organizations. And the reason is simple— business users finally have the opportunity to drive analytics in their organizations. While 2015 was the year of adopting self-service BI, 2016 will be the year of the massive roll-out. Self-service BI is becoming a commodity in 2016 with the number of business users growing rapidly. From a functional perspective, the success of self-service BI is greatly determined by its ability to:

●  Interact with the user. Self-service BI can be adopted quickly because end users are able to interact with massive amounts of structured and unstructured sources of information.

●  Make data and insights easily visible. Business users really recognize the value of making insights visible. The simple but clever idea of using visualizations and analyses to create your own stories (storytelling and infographics) is very successful. Nice examples are GEO-driven stories, dashboards , and D3 open- source visualizations. These, combined  with interactivity, make self-service BI a stunning combo. As I’ve mentioned before,  “our meetings will never be the same.” We can now use interactive, visualized insights to discuss and monitor the heartbeat of our company in real time!

●  Be agile with new and ever-changing data. A third success factor (what’s in a name J) to self-service BI is its agility. This agility is a huge value-add because it allows business users to really simply acquire and enrich new data and use it for analyses. Bear in mind, this also applies to Big Data using in-memory computing.

  1. Business Embraces the Portfolio LoopReal-time business wheel

I’ve made my point on the importance of the closed loop portfolio in earlier blogs. Every key customer I met last year who’s willing to embrace Digital Transformation is seeking an integrated and governed platform to analyze, plan, predict, and assess risks in a constant and permanent loop.

I use the word ‘integrated’ on purpose here, since here is where the difference is made—customers seek to have real-time integration between their business analytics, their detailed planning, and the predictive models that affect, for example, product mix or pricing strategy. The integration also needs to be on operational financials and towards risks and compliancy cases when needed.

Many of my customers have accomplished this on a near-integrated level that isn’t real time by using individual components that access each other’s data. Products like SAP Cloud for Analytics are revolutionary here since they provide the closed loop portfolio covering real-time, interactive integration on all mentioned areas. Markets have been waiting for this for quite some time and are eager to adopt. It allows them to interact with market fluctuations that speed up due to the Digital Transformation. You can look at the examples I described in a previous blog for the retailing sector to understand the scope of the closed loop portfolio.

Stay tuned for my next blog. I’ll discuss the other three trends I see for business analytics in 2016: analyzing Big Data, the acceleration of cloud BI, and  the growth of operational BI.

Follow me on Twitter @IverVandeZand.

Amick Brown is here for you.


The Real Business Intelligence

Ashith Bolar, Director of Research, Amick Brown

In the state of the art of computing, every company generates a large amount of data, and it goes without saying that every organization does some sort of data analysis on this data. Big and small companies invest in Business Intelligence in some shape or form. The ubiquity of big data infrastructures, such as those from SAP, as well as Hadoop and its various distributions also has enabled even smaller and medium sized businesses (SMB) to perform data analytics at scale.

glass wall meeting

Loosely speaking, Business Intelligence (BI) is a set of techniques and tools used to transform raw data into meaningful and actionable information. However, simply based on that definition, virtually every exercise in data analytics can be considered as Business Intelligence. The true value of a BI is only realized when the latest tools and technologies are applied in order to determine the historic, current and predictive views of the business.

One of the applications of BI is Predictive Analytics (PA). PA encompasses a large and fluid set of tools based on statistical and mathematical techniques to analyze historical data and subsequently build predictive models. The idea is that historical data contains patterns that, if recognized and correctly applied, can be used in predicting the future. This enables a company to predict and proactively respond to the future state of the business, say customer behavior, market conditions, etc.

growth graph

Take a look at your current BI system. Are you only analyzing  historical data, and at best enumerating the current state of your business? Or does your Business Intelligence platform help you model the future and enable you to predict the course of your business? Are you able to identify risks and opportunities well before they occur?

PA captures patterns and relationships among the various factors in your business, giving you a deeper perspective of risks or potentials associated with your current course of business. This enables you to make optimal changes to your business in order to make the most of the current and future market conditions.

Current technology offers very cost-effective means of Predictive Analytics that SMBs could implement with virtually no upfront cost.  SAP’s Predictive Analytics Software gives you a robust set of tools in this space. These tools run on your enterprise data and any supplementary data that you provide.

SAP’s Predictive Analytics Library (SAP-PAL) provides the following list of capabilities:

  • Predictive Modeling : automated set of tools to build predictive models
  • Predictive Scoring : identify and evaluate relevant variables in predicting
  • Predictive Model Management : enable end-users with limited knowledge of the science of predictive analytics to ask what-if questions
  • Predictive Network and Link Analysis : explore the links between your customers and network of strong social influencers with analytics
  • Predictive Data Management : automated data-set preparation for predictive modeling

Amick Brown can help you realize the predictive powers that you have with your SAP and BI platform provides you.

The Overwhelming Power of Analytics in Retailing and B2C: Part 2

Businessman Analyzing Graph


Contributed by  Iver van de Zand, SAP

Retailing and business-to-consumer (B2C) market requirements for online insights are relying heavily on the closed-loop portfolio. The permanent and online interaction of analytics towards rolling planning or predictive models applies all the time. As a follow up to Part One, today I’ll discuss the various ways analytics is applied in retailing and B2C. The situations below are far from exhaustive, but at least they provide insights into what I’ve experienced in various engagements with the retailing sector.

Retailing and B2C segments rely on real-time availability of data insights. Customer behavior, societal influences, the distribution column—they all fluctuate drastically and affect commercial behavior so intensely, that only real-time insights empower the retailer to monitor and adjust the closed loop portfolio. Needless to say, retailing and B2C require in-memory platforms, which provide the calculation and data handling power, plus the scalability, that are needed so badly.

At the base of getting insights are in-memory systems that track every single transaction done in the shops or online. An often-seen solution for this is called SAP Customer Activity Repository (CAR). SAP Customer Activity Repository is a foundation that collects transactional data that was previously spread over multiple independent applications in diverse formats.

Watch the SAP Customer Activity repository video HERE

The repository provides a common foundation and a harmonized, multichannel-transaction data model for all-consuming applications. Retailers can use SAP Customer Activity Repository to gradually transform their system landscapes from traditional database technology to the revolutionary, in-memory database technology.

Assuming the real-time platform and SAP Customer Activity Repository are available, what is the typical scope for this market segment’s insights using analytical components from the closed loop? Let’s have a look.

Basket Analyses

Basket analyses are the core insights that provide information about what people buy at what moment and at what location. We get insights into what is in their “basket.” The mix of products consumers buy is especially interesting. For example, a retailer can use real-time predictive models to predict whether a young female teenager buying red trousers might also be interested in purchasing accompanying earrings.

Sensor techniques can really help the shop employees to focus their advice specifically to the customer’s needs. Consider this shopping scenario:

  • Sensors inform an employee that a customer is picking a blue shirt, sized XXL from the rack.
  • Online analytics and predictive models immediately tell the employee on a mobile device that the customer took the wrong size (based on his buying history) from the rack.
  • The buying history then indicates that the customer typically buys three pieces at once.
  • The employee is also informed that the customer’s profile indicates he might be interested in buying jeans to go with the shirt he’s looking at (based on predictive models).
  • Finally, loyalty card information indicates that if the customer today buys four pieces, an extra bonus will be provided to his savings card.

All this information helps the employee interact with and sell to the customer.

Shop Performance

With shop performance, I mean the ability to use real-time, closed-loop analytics on anShop Performance
overseeing shop level. Sentiment analysis based on, for example, an impacting television show last evening where a popular boy’s band showed their new, hip-colored sneakers, might trigger the retailing group to discount a second article when customers buy similar sneakers. The agility here is crucial—sentiments are notified from social media analyses and action needs to be taken immediately.

Local influences could mean specific sizes of a product are sold very well in one place, but less well in other places. This might trigger shop management to re-allocate stock to other shops. The same thing applies to ranking capabilities—permanently monitoring top-bottom rankings per article, color-item or size is valuable, since the slightest social change (a big event in one specific city) might cause immediate changes in buying behavior locally.
Metrics

Customer Loyalty

Customer loyalty cards provide the retailer with a wealth of information if used well. The loyalty cards “identify” the person buying. We can see the consumers’ buying behavior, what they buy, and when. Tracking techniques (picking up  mobile devices’ signals when customers enter the store) show us in real time exactly where each customer spends their time in our shop, what is the route that customer typically follows, and what is their average visiting time.Retail

Retailers can go a step further by combining loyalty card information with the customer’s buying history and social media information. This further completes one profile, allowing the retailer to tailor make marketing initiatives on an individual level.

For example, I—as  customer X—might receive a special offer for a new external hard drive from a retailer, since combining data shows that I like audiophile equipment, buy music magazines (basket analyses) and spend quite some time at the electronics department when visiting that shop. The data insight is that I might need (or want) a storage device to store my music.

Customer loyalty cards might also bring great value to the customer retention program. Customers nowadays really quickly change their providers of goods because they are  enormously well informed.

Visitor Analysis


Weather Influences

Weather conditions greatly impact the buying behavior of customers. In general, windy weather has proven to have a highly negative impact on retail sales revenue. Making other general statements is difficult since a specific weather condition can have a positive effect on one type of retail, and a negative on another. Think about how cold weather might improve sales of books but negatively affect sales of handbags, for example. (A nice article focusing on the impact of temperature on shopping can be found at the Summit Blog.)

Likewise, a retail shop’s location—inbound or outbound—and its availability of underground parking are very important in rainy conditions. For retailers, it’s important  to realize that weather conditions have so much impact that they can’t be excluded from operational insights on shop performance. Thus, they must make them part of the closed loop portfolio.

Alternative Business Models

Retail and B2C markets are probably one of the most highly interesting market segments to follow. Why? Well, they’ll be under great change. The “Digital Transformation” age and the availability of information to both the retailer and the consumer are changing everything.

Consumers are not only wanting to know “everything” about their product, they are also shifting to buying (or should I say “renting”) a product experience rather than the product itself. For the latter, think about the accompanying services to a product that the retailer might want to offer. Have a look at this article from Forbes, which describes three trends for retail in the future—instant gratification, borrowing, and customization.

For me, there is enough food for thought to write a Part Three of the series on the overwhelming power of analytics within retailing and B2C. Stay tuned.

Follow me on Twitter – @IvervandeZand.

– See more at: http://blogs.sap.com/analytics/2016/01/06/the-overwhelming-power-of-analytics-in-retailing-and-b2c-part-two/#sthash.YIdYhjL9.dpuf

Data Driven Decisions improve your business

Fact Based Decision Making

For many companies the first reporting and analytics question that they ask is, “What specific items should my company measure?” However, what you measure should be based on how to get results from your data that make measurable change in the organization. The first question really is, “What are my business goals and what measurable components can help me achieve or miss this goal?

Decision Man

Some examples are:

  1. Churn reduction
  2. Retirement possibilities in the next year.
  3. Employees that leave in less than a year
  4. Departments with the highest attrition
  5. Supply chain service improvement
  6. JIT miscalculations by department or location
  7. Customer service complaints, late deliveries to customers
  8. Staffing variations and what affect this has on production 

Why fact based is important…

Another huge common occurrence in the reporting world is decisions made without trackable, measureable fact. Unbelievably, companies still make decisions with historical process, experience, and their “gut” to some degree.

With the availability of big data, your competitors are not only going to have access to information about themselves, but also about your customers and your ability to perform. If this data is not used well by your company – you will lose business.

So how exactly does your company aggregate data, produce reports, or glean insight to meet goals? If you are like the vast majority of companies out there, it is a big data dump into a spreadsheet that is picked through and interpreted by the individual who requested it.

Many have very slick Reporting solutions, but they are not leveraging them to the full potential – not by a long shot. Why is this? The pervasive gaps are that people are creatures of habit and continue to want to report like they have always done and change management/training is not factored in. The poor IT Manager put in charge of the BI project is inundated with data dump requests and help requests on-going.

Circling back to Data Driven Decisions, the very first things that must be carefully and completely determined are:

  1. What are the challenges that prevent me/my company from beating the competition, increasing revenue, operating smoothly, etc?
  2. What people drive the resolution of these challenges?
  3. What data and report metrics do these users need to show the golden road to overcoming the challenges?

Beginning with what decisions need to be made, which people will drive goal attainment, then what data and metrics will roll up to an answer – the first big hurdle to Business Intelligence success will have been overcome.

For more on this subject, watch this space… blogs.amickbrown.com/