Category Archives: Business Intelligence

All about BI

“Passionate on Analytics” , new book available

from Iver van de Zand

My book “Passionate On Analytics” is available now

Driven by a deep believe of the value of business analytics and business intelligence in the era of Digital Transformation, the book explains and comments with insights, best practices and strategic advices on how to apply analytics in the best possible way. 25 Years of analytics hands-on experience come together in one format that allows any analytics userHow proud can one be?

My first book titled “Passionate on Analytics” is now available from the Apple iBooks Store via this link.

Since I am evangelizing on interactive analytics every single day, I decided to create aninteractive ePub book. It contains over 60 best practice and tutorial videos, tons of valuable links and galleries and 33 extended articles providing insights on various analytics related topics.

Passionate on Analytics (206p) has 4 sections:

  1. Insights: 13 deep dive articles on various aspects of business analytics like industry specific approaches, embedded analytics and many more
  2. Strategy: 13 chapters talking analytics strategy related subjects and topics like defining your BI roadmap or the closed loop portfolio
  3. Best Practices: 10 expert sessions showing and demonstrating best practices in business analytics like using Hitherto charts, how to make a Pareto or visualization techniques
  4. Resources: a wealth (!) of resources on analytics

Please find below some screenshots.

I am very happy with the book with has brought up the best in me. Everything I learned, experienced or discussed during my 25 years tenure in business analytics, is expressed in this book. The book is fully interactive meaning you can tap pictures for background, swipe through galleries or start an tutorial video.

Special thanks goto Ty Miller, Timo Elliott, Patrick Vandeven and Waldemar Adams who I all admire a lot.

Iver


If the right people do not have the data they need, how can the intelligence be accurate?

By Ashith Bolar ,  Partner and Director AmBr Data Labs

Lack of user-acceptance is considered a failure of any new Information System — a rule that equally applies to a Business Intelligence initiative. And the astounding fact is that this is a very common occurrence. The reasons can be varied, such as the quality of data, the usefulness of the analytics provided by the system, or merely the user-interface being unfriendly.

However, what is not considered in assessing the success or failure of the system is the number of users who did not get access the system — an error of omission (pun intended). Typical IT projects finalize the initial set of end-users right at the inception of the project, and no later than the requirements phase. To manage the scope of the project, it is typical to keep a small and manageable initial user-base. However, I believe that this is a mistake!

I believe it is a mistake, that in trying to ensure the success of the project, the scope of the BI deployment should be restricted to a few. The true value of a BI enterprise is the crowd-sourced intelligence that you derive from it — and by this assertion: the more the merrier! Not only will a wider audience give us a better assessment of the success of our BI initiative, it will also ensure wider and quicker post-deployment enhancements.

Starting with a large audience of users has many challenges, least of which is managing the scope of the BI project. Given that a data warehouse typically contains sensitive data, one of the main concerns of a large user-base is data security — ensuring that only the right users get access to the right data. This concern leads to the usual decision of limiting the initial user-base to just the power-users, ones that require none or minimal data security.

pocker chips and aces

We see your challenge and raise you AccessOne©!

AccessOne is an information security software specifically designed for SAP™ Business Warehouse (SAP-BW). AccessOne allows you to build your access-control security in an easy excel-like matrix, and deploy it with a few clicks.  AccessOne can extract access information from your ECC system (be it role-based, structural authorizations, etc) or a traditional SoD ACL matrix, or even an excel file you created on your desktop. 

So that you can visualize AccessOne more completely–

A BI solution’s data security implementation is quite different from an OLTP system, even though they both try to achieve the same goal by means of a same set of parameters. The OLAP authorization mechanism works in the reverse direction of the procedures employed by an OLTP system.

See schematic below:

Take an example of an OLTP HR system / employee database. Here’s the sequence of events that occur when a user interacts with the system:

A1 1

Now consider its BI counterpart. The typical user request sequence goes something like this:

A1 2

Although, this is a simplified view, it’s easy to visualize the change in the mechanics of how authorization works between an OLTP and an OLAP system.

The power of AccessOne is in its ability to transform security parameters from the data structures that are designed for an OLTP system to the ones that are more suitable for an OLAP system. Moreover, AccessOne applies these authorization checks to any and all users of the SAP BI system. It will replicate your OLTP (ECC) system access parameters (role-based, structural, etc) into OLAP (SAP BW) system access parameters (analysis authorization). 

With this power, and with the guarantee that your BI system access is exactly the same as your ECC, you can now open up your BI system to all the ECC system users, be it power users, domain-specific users, supervisors, or individual-contributors.

Another power of AccessOne is “overriding” or “overloading” authorizations derived from OLTP. With a single access-control entry, you can override or overload (add to) the access of any user or user-group. For instance, if you have an end-user with limited access in the Finance ECC system, however you want to provide this user with extended access to the BW system on the finance cubes, this can be achieved by inserting a single access-control entry in the BI system.

In the following blog posts, we will examine some complicated yet typical case-studies to illustrate the power of AccessOne.

– Watch this Space –


2016 and Business Analytics: Be Prepared for a Smashing Year: Part One

by Iver van de Zand, SAP

The end of the year is always a time to reflect, but also a time to look ahead and think about what might be different or innovating next year.three-spheres

Reflecting on 2015, three things immediately come to mind:

  1. Interactive self-service business intelligence (BI) has definitely landed and earned its permanent place. Every top-100 customer I talked to has self-service business intelligence in its BI strategy plans.
  2. “Traditional” business analytics (as in managed reporting and dash boarding) is not sufficient anymore for full performance management. A closed loop portfolio of analytical, predictive, planning, and GRC information is becoming a necessity in today’s management of processes and business flows.
  3. The value of in-memory platforms is now being recognized by leading companies. They massively adopt in-memory platforms to not only run their core applications, but also to integrate business data and facilitate analytics.

Looking forward, I’m sure you’ll agree with me that analytics is heavily influenced by the readiness of organizations to adapt to change resulting from the Digital Transformation. Connected economies and networks, data that’s available at any moment at any level, and sensor techniques allowing for new business models—they all heavily influence our needs for insights. As such, they heavily influence the 2016 trends for business analytics.

Did Tableau Lose Its Head?

Recently, I did the Google search exercise for “BI Trends 2016″and was both shocked and amazed. Our friends from Tableau’s marketing department have succeeded in monopolizing  80% of the first 20 hits! However, if you read closely, you’ll notice they are all referring to the exact same article. (Though they all seem to be different articles, they all cover identical things.)

I was further shocked  by the lack of insights these identical articles cover.  My feeling is that the articles point out  BI trends for 2014 (or earlier). “Governance and self-service become best friends,” it says. Dear people from Tableau, self-service BI can only exist by the sake of data governance. If self-service BI is not governed properly, there is no sense for it. And the trend mentioned as “Data Integration gets Exciting”? This was something everybody focused upon in 2012.

Analytical Projections for 2016

So what can we expect for 2016? Personally, I can only reflect on what I see and hear when talking analytics with key customers every single day. For me, these discussions have provided food for thought. Listening to the plans that my customers have, I can extract five key trends for business analytics in 2016:

  1. Self-service BI will become a commodity
  2. Business will embrace the portfolio loop
  3. Companies will really analyze Big Data
  4. Cloud BI adoption will accelerate
  5. Operational BI footprint will grow

Let’s take a closer look at the first two trends in today’s blog.

  1. Self-Service BI Becomes Commodity

Governed self-service BI will further find its way to all echelons of organizations. And the reason is simple— business users finally have the opportunity to drive analytics in their organizations. While 2015 was the year of adopting self-service BI, 2016 will be the year of the massive roll-out. Self-service BI is becoming a commodity in 2016 with the number of business users growing rapidly. From a functional perspective, the success of self-service BI is greatly determined by its ability to:

●  Interact with the user. Self-service BI can be adopted quickly because end users are able to interact with massive amounts of structured and unstructured sources of information.

●  Make data and insights easily visible. Business users really recognize the value of making insights visible. The simple but clever idea of using visualizations and analyses to create your own stories (storytelling and infographics) is very successful. Nice examples are GEO-driven stories, dashboards , and D3 open- source visualizations. These, combined  with interactivity, make self-service BI a stunning combo. As I’ve mentioned before,  “our meetings will never be the same.” We can now use interactive, visualized insights to discuss and monitor the heartbeat of our company in real time!

●  Be agile with new and ever-changing data. A third success factor (what’s in a name J) to self-service BI is its agility. This agility is a huge value-add because it allows business users to really simply acquire and enrich new data and use it for analyses. Bear in mind, this also applies to Big Data using in-memory computing.

  1. Business Embraces the Portfolio LoopReal-time business wheel

I’ve made my point on the importance of the closed loop portfolio in earlier blogs. Every key customer I met last year who’s willing to embrace Digital Transformation is seeking an integrated and governed platform to analyze, plan, predict, and assess risks in a constant and permanent loop.

I use the word ‘integrated’ on purpose here, since here is where the difference is made—customers seek to have real-time integration between their business analytics, their detailed planning, and the predictive models that affect, for example, product mix or pricing strategy. The integration also needs to be on operational financials and towards risks and compliancy cases when needed.

Many of my customers have accomplished this on a near-integrated level that isn’t real time by using individual components that access each other’s data. Products like SAP Cloud for Analytics are revolutionary here since they provide the closed loop portfolio covering real-time, interactive integration on all mentioned areas. Markets have been waiting for this for quite some time and are eager to adopt. It allows them to interact with market fluctuations that speed up due to the Digital Transformation. You can look at the examples I described in a previous blog for the retailing sector to understand the scope of the closed loop portfolio.

Stay tuned for my next blog. I’ll discuss the other three trends I see for business analytics in 2016: analyzing Big Data, the acceleration of cloud BI, and  the growth of operational BI.

Follow me on Twitter @IverVandeZand.

Amick Brown is here for you.


The Real Business Intelligence

Ashith Bolar, Director of Research, Amick Brown

In the state of the art of computing, every company generates a large amount of data, and it goes without saying that every organization does some sort of data analysis on this data. Big and small companies invest in Business Intelligence in some shape or form. The ubiquity of big data infrastructures, such as those from SAP, as well as Hadoop and its various distributions also has enabled even smaller and medium sized businesses (SMB) to perform data analytics at scale.

glass wall meeting

Loosely speaking, Business Intelligence (BI) is a set of techniques and tools used to transform raw data into meaningful and actionable information. However, simply based on that definition, virtually every exercise in data analytics can be considered as Business Intelligence. The true value of a BI is only realized when the latest tools and technologies are applied in order to determine the historic, current and predictive views of the business.

One of the applications of BI is Predictive Analytics (PA). PA encompasses a large and fluid set of tools based on statistical and mathematical techniques to analyze historical data and subsequently build predictive models. The idea is that historical data contains patterns that, if recognized and correctly applied, can be used in predicting the future. This enables a company to predict and proactively respond to the future state of the business, say customer behavior, market conditions, etc.

growth graph

Take a look at your current BI system. Are you only analyzing  historical data, and at best enumerating the current state of your business? Or does your Business Intelligence platform help you model the future and enable you to predict the course of your business? Are you able to identify risks and opportunities well before they occur?

PA captures patterns and relationships among the various factors in your business, giving you a deeper perspective of risks or potentials associated with your current course of business. This enables you to make optimal changes to your business in order to make the most of the current and future market conditions.

Current technology offers very cost-effective means of Predictive Analytics that SMBs could implement with virtually no upfront cost.  SAP’s Predictive Analytics Software gives you a robust set of tools in this space. These tools run on your enterprise data and any supplementary data that you provide.

SAP’s Predictive Analytics Library (SAP-PAL) provides the following list of capabilities:

  • Predictive Modeling : automated set of tools to build predictive models
  • Predictive Scoring : identify and evaluate relevant variables in predicting
  • Predictive Model Management : enable end-users with limited knowledge of the science of predictive analytics to ask what-if questions
  • Predictive Network and Link Analysis : explore the links between your customers and network of strong social influencers with analytics
  • Predictive Data Management : automated data-set preparation for predictive modeling

Amick Brown can help you realize the predictive powers that you have with your SAP and BI platform provides you.

Artificial Intelligence meets Business Intelligence

By Ashith Bolar, Director of Research, Amick Brown

It’s bound to happen:  Artificial Intelligence (AI) will meet Business Intelligence (BI). In fact, in several places, it has already happened. But let’s take some time to see how this convergence is progressing, if at all.

The first decade of the 21st century was all about Business Intelligence. Towards the end of the decade, big strides were made to harness the explosion of Big Data. The second decade has been mostly about fuelling Business Intelligence with the Big Data. Several companies, large and small, have been making very impressive strides in this direction. However, there is still a lot of room for improvements.

On the other side in the world of computing, Artificial Intelligence has been making slow inroads in all aspects of life. In the last 15 years, AI has been creeping up into our personal lives with applications such as Siri, the entire Google ecosystem, and a myriad of social networking applications. All of this is happening without us realizing the amount of AI happening behind the scenes. Artificial Intelligence has moved out of the academic realm towards the daily lives of consumers.

Much of the business community associates AI with machine learning algorithms. While that’s true, it leaves much of AI underappreciated for its real capacity in Business Planning and Data Analytics. There is more to AI than just recommending your next movie on Netflix and making Google give you better results on your web search.

There are several applications and platforms that transform and summarize a corporation’s big data. However, ultimately it’s the humans that consume this summary of data, to make decisions based on higher human intelligence. I argue that this will change over the next decade. If history is any indication of how accurate our predictions of coming technological revolutions are, I would imagine this transformation will happen much sooner than a decade.

Most of us know Big Data and the Internet of Things that has enabled this explosion. Big Data infrastructure does much of the heavy lifting of cleaning up, harmonizing, and summarizing this data. However, the actual process of deriving intelligence and insights is still within the human realm.

Inevitably, the future of Business Intelligence goes hand in hand with Artificial Intelligence.

The new wave of BI software should be able to perform the basics of building data analytics models without human intervention. These systems should be able to generate hundreds of models overnight. The next step is to build systems that not only generate redundant set of models, but also identify the good models – ones that model reality accurately – and weed out the bad models. The third wave of solutions will be the ones that make a majority of decision making for a company.

In the coming posts, we will explore in more details some of the initial attempts of converging Artificial Intelligence and Business Intelligence.

The Closed Loop portfolio in Analytics

The Closed Loop portfolio in Analytics

Authored by Iver van de Zand, SAP

We talked about the overwhelming power of analytics in Retail and B2C market-segments earlier and one of the topics discussed there, was the integration of operational business activities with operational analytics. In the example we saw the stock manager using analytics to change his stock-buying-behavior. He adjusted his order system by choosing another vendor and placing the order. Immediately his analytics are updated and he now requires to adjust his rolling planning or run a predictive simulation how the price-adjustment of his new stock might affect buying behavior of his customers. He might even want to adjust the governance rules with his new supplier or run a risk-assessment.


Below pictures visualizes the continuous integration of core business activities with business analytics, indicating examples of core processes with their accompanying analytical perspectives. These are just examples and not exhaustive at all.


Performance Management closed loop

Basically what the stock manager in our example needs, is a full – real-time – integration of business analytics with his core business activities over all aspects of his performance management domain. A predictive simulation of changing buying behavior lead to new analytical insights on product mix which might influence the companies’ budget and causes a risk analysis for new vendors.

To do so, a closed loop is required of following core components driven by the continuous flow of Discover – Plan – Inform – Anticipate:

  • online Analytics on big data with interactive user involvement
  • ability to adjust and monitor a rolling Planning for budgets, forecasts. A planning that that allows for delegation and distribution from corporate level into lower levels
  • GRC software to perform risk analyses on for example vendors or suppliers
  • online Predictive analyses components to apply predictive models like decision trees, forecasting models or other R algorithms. Predictive analyses allow to look for patterns in the data that “regular” analytics is not able to discover. The scope of predictive analytics is gigantic: think not only sentiment analyses for social media, but also basket analyses in retail markets, attrition rates in HR and many, many more.


This so-called closed loop of predictive analytics, planning and performance management, business analytics and GRC is NOT a sequential process at all. They interact randomly towards each other in real-time and at any moment needed. They are also dependent towards each other, since Digital Transformation requires us to be so agile, we have to constantly execute and collaborate on the interoperability of the components and monitor the outcome. Lastly, the closed loop platform interacts on core operational activities (real-time insights in operational data) and as such the analytics are defined as Operational Analytics.

Closed loop platforms more than anything else require business users to drive its content and purpose. They drive the agility to the platform that is so heavily needed in the Digital Transformation era. On the other hand the technical driven architects do make a difference too, since closed loop platforms are very sensitive to respect governance principles. A special role is allocated to the CFO or Office of Finance here; they will drive the bigger part of the Planning and Budgeting cycle.

One can imagine the calculation processes behind the closed loop platform are huge and therefor a business case for an in-memory system is a sine qua non.

Imagine the possibilities

Needless to say that the closed loop model applies to all industries and not only in the retail example that I used here. I can list plenty of examples here but just to name a few:


  • HR: attrition rates of employees
  • Banking & Insurance: customer segmentation, product basket analyses
  • Telco & Communications: churn and market segmentation nut also network utilization
  • Public Government: Fraud detection and  Risk-Mitigation
  • Hospital: personalized healthcare

Apart from imagining the possibilities per market segment, we can also change perspectives and look at the possibilities per role within companies applying the closed loop platform. Below picture provides capabilities the closed loop components could offer to various user communities. The potential is huge and extremely powerful when used in an integrated platform. This is also the weaker point of the closed loop platform: the components must be integrated not to miss their leveraging effect on each other.

A solution is available today

With its Cloud for Analytics offering, SAP is today the only provider with an integrated offering for the closed loop platform. Even more: SAP Cloud for Analytics is integrated in one tool offering analytics, planning, GRC and predictive capabilities. One tool?? …. Yes, one tool completely Cloud driven and utilizing the in-memory HANA Cloud Platform it is running on. One tool that seamlessly lets analytics and planning interact with each other. A tool where you can run your predictive models and analyses and visualize the outcome with the analytics section. A tool that allows access to both your on premise data, your Cloud data and/or Hadoop stored data. And lastly a tool with fully embedded collaboration techniques to share your insights with colleagues but also involve them with planning or others.  Our dream becomes reality.


Top Three Hurdles to Successful Reporting and Analytics

This is a first conversation based on what I am hearing in the market. There will be more to come, and I want your thoughts please. Let’s make a difference. 

Top Three Hurdles to Successful Reporting and Analytics

The challenge of useful, powerful, and appreciated Business Intelligence is felt across industries, departments, and roles. By using BI well, you will position yourself to beat your competition. If you do not use the data available to drive business decisions and goal attainment, you position your competitors to win – because they ARE leveraging their data.

What is the definition of successful Business Intelligence?

My best practices definition is “Success is measured by the ability of the right people, to use the right data, and create usable reports that aid in business goal attainment”.

Sounds simple, right? Well it will be with planning, understanding and buy-in from users at all levels. It is truly a change management issue as well as a technology issue. IT will drive the technology side, but must work hand in hand with the various business leaders to develop outcomes that make a difference in efficiency, process, and profitability.

The Top 3 Hurdles to BI Success:

  1. “Give me all of the data and I will figure out what I need”

Users, Managers, and Executives do not realize the depth of business case resolution that their data can provide. The approach tends to be, “give me all of the data and I will figure out what I need and want to use.” Inherently, this is manufacturing the outcome instead of letting it manifest organically.

Tied closely to this request is the real situation that people do not like change. They “have always done it this way” is a first cousin to the data dump method. Overcoming a historic process can be harder than learning how to use BI well.

With the powerful BI tools available, dashboards and reports can be targeted to achieve business success. These successes will be defined by each leader based on corporate goals. The tough part comes in taking a measurable goal and allowing the solution to mine the data from various sources to provide accurate reports from which to make decisions. Long story short – is the report authentic and actionable.

  1. “My data is a mess ! “

How many times have I heard that reporting and analytics is a moot point because the data flowing in has not been cleansed or integrated in years. Well then, we know where to start because this statement is true. Garbage in is garbage out.

So, this hurdle to BI success becomes part of the solution. Regardless of how simple the reporting and analytics outputs are, their foundation must be in valid data.

Housekeeping is essential – so the longer cleaning the house is put off, the dirtier it will get.

  1. One and done is not an option

Let’s look at a very common situation: When the shiny new “box” of BI software came – the enthusiasm was real. Users throughout the company were vested and interested in the cool reports that they would be able to generate. Well, that was 8 years ago. Hopefully much has changed in your business since then. The reports, however, have not changed. You are measuring and dwelling on 8 year old business challenges. This is definitely not effective.

A proactive sustainability plan will separate the average performing BI users from the rock stars. Incorporate this into your reporting and analytics plan!

YES – THIS IS PURPOSELY REPEATED – IT’S IMPORTANT

This is a first conversation based on what I am hearing in the market. There will be more to come, and I want your thoughts please.

 The challenge of useful, powerful, and appreciated Business Intelligence is felt across industries, departments, and roles. By using BI well, you will position yourself to beat your competition. If you do not use the data available to drive business decisions and goal attainment, you position your competitors to win – because they ARE leveraging Big Data.


Thinking Machines – Part 3

This is the third and last installment of a 3-part series on machine learning. If you want to read the first two parts, follow the links below. The outline of the 3 installments is:

  1. Machine Learning Introduction
  2. Various implementations of machine learning
  3. Impact to business of machine learning computers

In the last two posts, we explored the idea of Machine Learning and its application. This post will be about how learning machines, and computers in general, impact and influence businesses and vice versa.

Humans and machine have had symbiotic relationships. While humans shape machines, the irony is that machines have shaped humans just as much as, if not more. I don’t mean it literally, but machines may be seen to have influenced human progress in the political, social and most importantly economic systems to their current state of the art. Science and technology has been the center-stage of philosophical discourse in the Western hemisphere for more than three centuries. And computers have been the engine behind the economic success of the past few decades.

While it may be argued that the era of machines began either with the start of the Industrial age, or later at the Machine age, in the context of this post it really didn’t begin until the 1890 US Census. Herman Hollerith’s punched cards and the tabulating machine essentially cut down the census time from 8 years to 1 year.

“[Hollerith’s] system made it possible for one Census Bureau employee to compute each day the data on thousands of people, keypunching information that had been captured by tens of thousands of census takers.”

Library of Congress

http://memory.loc.gov/cgi-bin/query/r?ammem/mcc:@field(DOCID+@lit(mcc/023))

If a rudimentary computer by today’s standards can shave off 7 years, then imagine the time-savings today’s computers can provide. Of course, this tremendous positive impact is not without its negatives. This automated system measurably replaced thousands of Census Bureau employees overnight.

Since then, there has been a steady employment of computing machines replacing humans. After the end of the Second World War, ENIAC and UNIVAC paved the path for electronic computers to dominate business computation.

The business of running business has been transformed by newer and more powerful electronic computers. Again, as in the US Census case, while the economic sector has reaped the benefits the labor market saw the most negative disruption in this new world.

In the first wave of these computers, the world saw the low-skilled jobs vanish. Jobs that required repetitive tasks, especially ones that involve computations on large sets of numeric data, were slowly transitioned to automation. People holding jobs that can be described as routine and codifiable were the first to see the door. While in the early part of the 20th century, the job market was dominated by low-skilled workers, a constant decline in this class of jobs can be directly attributable to computers.

However, another trend that has caught the eye of the economists and policy makers is called the Polarization of the job market. Wikipedia describes it as “when middle-class jobs—requiring a moderate level of skills, like autoworkers’ jobs—appear to disappear relative to those at the bottom, requiring few skills, and those at the top, requiring greater skill levels.” As this chart depicts (by Harry Holzer and Robert Lerman [http://www.urban.org/UploadedPDF/411633_forgottenjobs.pdf]), while there has been a modest (and insignificant) growth in low-skilled jobs, there has been a constant decline in mid-level jobs – from 55% of all jobs in 1986 to 48% in 2006. What is notable is that the loss in mid-level skills is mostly offset by growth in high-skilled jobs.

laborstatistics

http://www.urban.org/UploadedPDF/411633_forgottenjobs.pdf

It is clear that technology and automation has caused a good deal of increase in wealth and prosperity. However, economists such as Joseph Stiglitz and Thomas Picketty have eloquently and persuasively argued that the problem is that the gain in wealth is concentrated in a relatively small number of participants in the economic system. Drawing from the experiences from the past, a policy dedicated to public and private investment in education and specialized skills training to the impacted masses is advised.

Having stated that the threat to low-skilled and mid-skilled labor categories is imminent, it seems to me that there is complacency on the high-skilled labor category. The general consensus is that high-skilled jobs will continue its strong growth. While I don’t argue that this consensus is wrong, one should, however, employ caution in prophesies such as these. Computers are increasingly doing tasks that had once been deemed impossible to be automated. Let’s take a look at some examples, where smart machines are doing high-skilled jobs.

Robojournalism

A surprising amount of what we read in newspapers and journals are actually written by computers with no human aid. Robojournalism was brought to people’s attention by “Quakebot”, a program written by Ken Schwencke. Quakebot wrote the first news article about the Mar-2014 earthquake off the Pacific Coast. This was not the first time a computer was employed to write news posts. But since then, robojournalism has gained momentum. Soon after, Associated Press announced that “the majority of U.S. corporate earnings stories for our business news report will eventually be produced using automation technology.” AP and Yahoo use a program called Wordsmith, developed by Automated Insights.

A particularly interesting case study is that of a Chicago-based company called Narrative Science They developed a piece of software called “Quill”, and similar to the earlier examples, this is a Natural Language Generator (NLG) platform that can process data, mostly in numerical format, and convert it into perfectly written narratives to be consumed by humans. Narrative Science started off by commercializing a research project at Northwestern University. It was first adopted to be used by sports channels and websites to report headlines for baseball games. It did so just by looking at the numbers. Take a look at this text that Quill generated:

Tuesday was a great day for W. Roberts, as the junior pitcher threw a perfect game to carry Virginia to a 2-0 victory over George Washington at Davenport Field.

Twenty-seven Colonials came to the plate and the Virginia pitcher vanquished them all, pitching a perfect game. He struck out 10 batters while recording his momentous feat. Roberts got Ryan Thomas to ground out for the final out of the game.

http://deadspin.com/5787397/we-heard-from-the-robot-and-it-wrote-a-better-story-about-that-perfect-game

This is an excerpt straight from Quill – no human literary intervention. This is just by parsing the box score of the game.

Narrative Science has taken this to the market to have their software write narratives for financial reports, etc.

Automatic Statistician

Big Data has generated a renewed interest in data analysis, especially applying statistical concepts to data in order to derive insights and meaning from large swaths of raw data. People calling themselves data scientists are popping up everywhere. Their main job is to take a deep look at the data (perform statistical analysis and modeling on it) and identify patterns and insights in it. These patterns and insights are valuable in predictive analytics as well as operations research. Automatic Statistician is purportedly in the business of automating this process of discovery.

Automatic Statistician is the brainchild of Zoubin Ghahramani and his research team at the Department of Engineering – University of Cambridge. They set out to make a computer do what a Data Scientist is paid to do – make sense of data. Automatic Statistician gained recognition outside the academic circles when Google awarded the team the Google Focused Research Award. At the writing of this post, Automatic statistician is still in its early stages. Yet it has shown strong potential in applying statistical and machine learning methods on raw data, and automatically discovering trends in data; completely unsupervised.

Below is the screenshot of the automatic analysis and report by Automatic Statistician, when fed the raw data of unemployment figures

automaticstatistician

http://www.automaticstatistician.com/abcdoutput/11-unemployment.pdf

There are scores of interesting examples such as these. Machine Learning has been gaining momentum over the past decade. To repeat Ken Jennings’ sentiment: I, for one, welcome our new computer overlords.

Conclusion

Technological innovation has been reshaping the labor market for a long time now. One can date it back to the industrial revolution. For all the buzz the phrase “Big Data” has created in the recent past, I believe the advancement in AI, Robotics and Machine Learning, applied to big data is one such wave – one that will change the way we are used to do things. Many jobs from today will not exist in the near future, and many jobs in the near future are completely unknown right now. Phone operators didn’t exist for most of 18th century and neither did rocket scientists until the early 20th. Web-developers and computer network analysts didn’t exist for most of the 20th century.  Big Data, AI and Machine Learning will lead to jobs that we just cannot imagine at this time.

Sure, this disruptive technology is going to negatively impact the labor market, but there is more to gain. Technology is a net job-creator. However, to mitigate the short term negative impact, a strong role from both the government and private sector is prescribed by policy experts and economists.

Computers in business are not just about making machines do the drudgery that we do not want to do. Today’s computers are much smarter – they can simulate thinking and reasoning that was previously thought of as a purely human endeavor. Today’s computers help us strategize, perform market analysis, build modes, and explore new opportunities. Tomorrow’s thinking machines will not just be helping us, but modeling these themselves, in an unsupervised way.


Thinking Machines – Part 2

This is the second installment of a 3-part series on machine learning. If you want to read the first part, the link is below. The outline of the 3 installments is:

  1. Machine Learning Introduction
  2. Various implementations of machine learning
  3. Impact to business of machine learning computers

The last installment will be published in the next few weeks. I will update this article with a link to it.

In the last post, we outlined the basic underpinnings of Machine Learning in the context of Big Data. Here we shall examine some implementations of Machine Learning, a discipline that stemmed from research into Artificial Intelligence (AI), especially concerning algorithms that learn from the data autonomously. In this post, let’s look at some AI machines programmed to perform machine learning, and their fascinating results and occasionally surprising side-effects. Although the focus is on machine learning, the mechanics themselves belong to a broader context of AI.
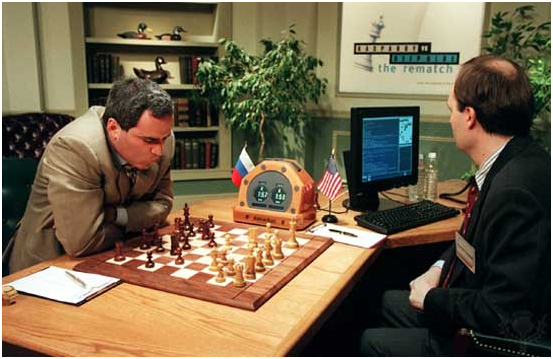
Deep Blue

On February 10, 1996, a computer called Deep Blue beat a human at a game of chess. What was historic about this was the fact that the human was the reigning world chess champion, Gary Kasparov. Although, eventually Kasparov went on the beat the computer, it was the beginning of the end of human dominance in this extremely strategy-based board game.

Then in May 1997, the same computer after several upgrades played Kasparov again. This time the computer beat Kasparov 2-1 in a 6-game tournament. If there was any debate that a computer cannot beat the best human in a game of chess, this put an end to it. Or did it?

Deep blue is just as fascinating in what it is not, as much as in what it is. While, technically, Deep Blue’s deep knowledge of chess came from learning prior games, its super-power truly lies in its massive processing capacity. Deep Blue is a massively parallel system (technical term for a lot of processors, running in parallel), with 30 processors plus 480 chess chips. In simple English, it’s a beast. It can process nearly 300 million positions/moves per second.

That raises a question: Is Deep Blue really a learning machine? Firstly, according to the rules of the tournament, Deep Blue’s developers were allowed to alter/upgrade the software between games. This means that Deep Blue’s engineers were learning the game and teaching it to the computer, rather than the computer doing it for itself. But IBM chalks it up to upgrading the system’s learning mechanism. Fair enough.

Compare deep blue’s functioning to how a human thinks. A human gets better and better at playing chess as they play more and against better opponents. Even if IBM engineers were right in that their inter-game intervention was only upgrading, the question still is: Does deep blue understand the game of chess and its strategies the same way a human learns. I am not referring to the wetware [http://en.wikipedia.org/wiki/Wetware_%28brain%29] vs hardware/software argument. Humans obviously are not processing more than 200 million moves per second: far from it. Deep blue, on the other hand, does have this capability and uses it quite effectively. This clearly points to the difference in human insight and the brute force a computer. Deep Blue may or may not have had the same insight Kasparov had, but at the end of the day, Deep Blue won.

bigblue


Source: Encyclopaedia Brittanica
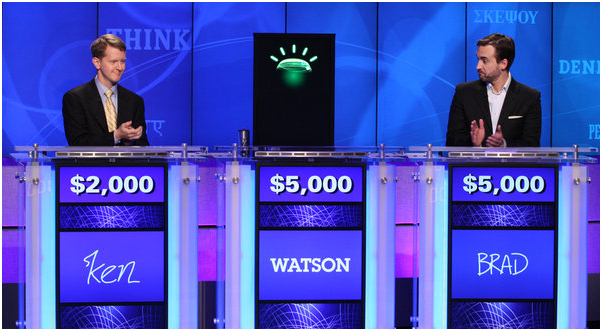
Watson

For our second example of an artificially intelligent computer, we go back to IBM.

In 2011, Watson played Jeopardy! (a popular TV quiz show) with Brad Rutter and Ken Jennings, former winners of the game show. Brad Rutter never lost Jeopardy to a human opponent. Ken Jennings, of course, holds the record for the longest winning streak in Jeopady history, 73 in total. Together, these two men had walked away with more than $5 million dollars, when they played against Watson. In a 3 day tournament, Rutter and Jennings went head-to-head against Watson, only to see Watson trounce them in the end.

While crunching numbers is something computers are very good at, language processing has been a very challenging problem in computer science. IBM set out to take this challenge up, when they designed and built a computer named Watson. More specifically, Watson was exclusively designed to answer trivia questions asked in natural language.

Watson’s first task is to extract meaning from a vast database of documents, ranging from encyclopedias, news articles and literary works – millions of them. Keep in mind that this is not the same as Google’s search engine indexing the Internet. Document searching (and page ranking) is to take a keyword as query and return a list of documents that are relevant to the query. While a search engine knows the words in the indexed documents, Watson is supposed to understand the contents of the documents.

Understanding Human language is a difficult task for a computer, which thrives in a world of discrete numerical constructs. Real language is full of implicit and ambiguous references, whose meaning can only be extracted within the context of the conversation.  Take for instance this phrase: “I like tea, but Java is what gets me going.” An average English speaker has no problem understanding that Java is a reference to coffee. We will be hard-pressed to find people who would mistake this java for either the computer programming language or one of the main islands in Indonesia. For a computer, on the other hand, this is a very difficult task – determining meaning by context. A compute trying to understand a phrase like “Here I am sitting in my hotel room in Java, sipping on my Java, and coding away in Java” would probably lead to a blue-screen-of-death [http://en.wikipedia.org/wiki/Blue_Screen_of_Death].

Let’s take look at how Watson discovers the right answer to a given question. Just like Deep Blue, Watson is a massively parallel computer: one built with a cluster of 90 IBM Power 750 servers, each one powered by an 8-core processor. All added up, Watson had 2,880 POWER7 processor cores and 16 tBs of RAM. Watson ran on SUSE Linux Enterprise Server OS using Apache Hadoop’s distributed computing framework.

On this infrastructure, Watson ran IBM’s DeepQA software, a software designed to run on massively parallel infrastructure. The mechanism with which this computer turned trivia questions is as impressive as the hardware and software it ran on.

Watson firstly, accumulated a vast amount of knowledge by storing and indexing millions of documents. When Watson received a question, it would first perform a task called “Question decomposition,” where it would break down and parse the question/clue into keywords and phrasal fragments. It would then run several natural language analysis algorithms on the decomposed question phrases, all in parallel. The more algorithms that return with the same answer, the more confident Watson becomes of that answer.  These two steps were “hypothesis generation” and “evidence scoring.” Based on this scoring, Watson would then rank the hypotheses. Together, score and rank, helped Watson determines the “confidence” it had in the answer. When the confidence is high enough, Watson would buzz the answer.

Jennings and several experts in the field of neuroscience and artificial intelligence are convinced that this is very similar to how a human brain works, under the same circumstances.

Answering Trivia might sound trivial, but the implications of Watson are far-reaching. From then on, Watson went on to do some serious work around the world. You can read more about it here

http://www.forbes.com/sites/bruceupbin/2013/02/08/ibms-watson-gets-its-first-piece-of-business-in-healthcare/

The final scores of the Jeopardy! game was:

  • Rutter: $21,600
  • Jennings: $24,000
  • Watson: $77,147

Ken Jennings, in his final jeopardy question, wrote underneath his answer: “I for one welcome our new computer overloads.”

watson


Source: New York Times


Other examples

While doing research for this article, I came across several fascinating examples of machine learning and artificial intelligence. In the interest of keeping this article short, I have not included them. If you’re interested in hearing more fascinating stories like these, please leave a comment at the end of this post. If there is enough interest, I will put them together in a separate post.


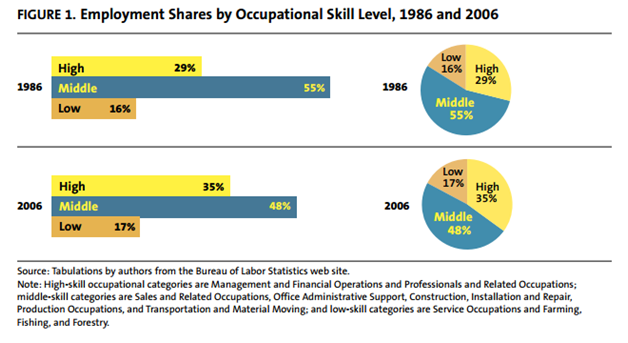
We are seeing a technological revolution, one that began at the turn of the century. In the past, though, technology replaced manual labor and work that involved a high degree of calculation. But recently we are seeing great progress made in domains which were previously thought to be exclusively human domain – thinking, learning, and strategizing. Increasingly this new computing paradigm seems to be encroaching and infringing upon our prized abilities. From the 19th century till the end of the 20th century we saw robotics replacing jobs that required manual labor. But the current trend is of replacing mid- and high-skilled workers. The computer that beat us at chess and trivia pave a path for the computers that will replace business strategists, scientists, doctors. Creativity will soon be replaced by algorithms for creativity.

There are social implications that we need to be concerned about, apart from the economic benefits of these. In the next post (the 3rd installment of this series), we will examine exactly these :  the economic and social implications of the new wave of learning machines.

Thinking Machines – Part 1

This is the first installment of a 3-part series on machine learning. The outline of the 3 installments is:

  1. Machine Learning Introduction
  2. Various implementations of machine learning
  3. Impact to business of machine learning computers

The remaining installments will be published in the next few weeks. I will update this article with links to them.

Can you build a computer that can think for you, and may be run your business? Computers have been an integral part of any business enterprise for a long time now, insomuch that everything we do in business has computers’ finger prints all over. But the primary function of computers has been that of aiding the humans in their running of the business, not actually running it for us. But a brave new generation of computers is on its way that plan on turning this paradigm on its head.

Imagine computers that think, that understand how your business is run, recognize what works and what does not, correct issues as they go along, and most importantly, ones that do this with virtually no aid from you. These computers almost do not exist today, but will be business-as-usual someday.  What does it entail to build such computers? How much of this is hype and how much reality? What are the classes of problems these computers are expected to solve? A branch of study in Artificial Intelligence (AI) called Machine Learning has been trying to answer these questions.

What is machine learning?

A typical computer program is a series of instructions executed on a set of data. The code is supposed to read the data, manipulate and transform it. Machine learning, on the other hand is not about transforming data, instead about recognizing patterns in the data, discovering deep insights in the structure of the data, all on its own. In fact, it is even more than that: It is about a computer that understands data and gets smarter and smarter.

Machine leaning is about creating algorithms that start with a blank slate, and builds up its knowledge as they process and analyze data. The bigger the data, the smarter they get. The do so in a variety of ways.

Take for instance, a hypothetical chess-playing learning machine. This machine first learns the basic rules of chess by watching people playing chess – rook moves horizontally and vertically, bishop moves diagonally, etc.  Then the computer learns the goal of the game – to win. To extend this example further, the computer learns how to achieve the goal. It learns from the games strategies. While the computer is never coded to perform any specific list of chess plays, it is designed to learn them from the input data – studying previous games and reassessing the games it plays against its opponents.

Hypoethetically, one copy of this software is given amateur chess player, and another one to, say, Gary Kasparov (former world chess champion), and both are allowed to play solely against their masters. After a certain period of time, if these two copies are made to go head to head, the latter copy will trounce the former. This is because the latter learned from a superior dataset, one that was accumulated playing against Kasparov.

To Teach or not to Teach

Broadly speaking, there are two categories of learning algorithms: Supervised and Unsupervised. If the input data also known as training-set is clearly labeled – the computer knows what it is looking at – then it is supervised learning. However, if your data is a big clutter of bits, and the computer starts off without knowing what it is looking at, but it learns as it goes along, that would be unsupervised.

For example, a face-recognition learning system processes several images of faces and non-faces from a training-set that is clearly labeled – faces in each image are marked and labeled. During the learning process, the computer isolates the unique features of faces that are not to be found on non-faces. Subsequently, the computer is now equipped with the “knowledge” of how to distinguish between faces and non-faces. The more images of faces and non-faces it processes, the stronger its knowledge is.

On the other hand, in the construction of a computer that classifies human emotions. The training-set contains no labels for facial expressions and how they correspond to human emotions. The system is fed series of video snippets with human faces containing various emotions and their subsequent actions. Your computer is supposed to see the subtle changes in the facial expression and group them into various categories and associate them with the subtle difference in the subsequent actions of these actors.

Given that these two examples of very simple, there may be an overlap in their classification. But the essential idea is this: Supervised is when the computer clearly starts off knowing what it needs to do, and goes on to becoming really good at doing that. On the other hand, in unsupervised learning, the computer typically has no idea what it is looking at or what it’s supposed to find, and then goes on to discover hidden pattern and deep structures in data.

Although different functionalities dictate which learning is more suitable for the specific purposes, when it comes to the context of big data, unsupervised learning algorithms are expected to be heavily used in the near future. Unsupervised learning is well-suited in systems of data which contains deep hierarchical and/or causal relationships between observations and/or latent variables.

Learning algorithms may not clearly fall along this dichotomy. Most algorithms have a combination of the two. Within the same system, some aspects of learning may be supervised, while others may be unsupervised.

Business Intelligence vs. Learning Machines

There are some striking similarities between the data mining components of Business Intelligence suites that are used for pattern recognition, and the actual machine learning implementations. While BI data mining is a set of tools and techniques used by humans to aid in pattern recognition and eventually make better decisions, machine learning is performed primarily to the advantage of the machines themselves — in order to perform better by reorganizing itself. There is a significant overlap in the various techniques used in these two domains of data analysis.

So how does a computer learn?

Another way of classifying learning machines is the expected output. Let us see the kinds of output we expect from these computers.

Regression Analysis: The excepted output of this computer is to find hidden relationships between two or more variables. For e.g., is there any relationship between the weather outside and my sales data.

Classification: The expected output on this learning system is to take a large chunk of data and classify them according to preset categories. For e.g., what criteria can I use to categorize my employees as top performers, team players and laggers.

Cluster Analysis: Similar to classification, cluster analysis takes a series of similar objects and classifies them. The difference between this and the previous method is that clustering has not preset categories. Objects scatter over the data-space, and computer identifies clusters in them. For e.g., identifying customer clusters for targeted marketing

Computers can learn to run your business for you

While the science of machine learning has been flourishing in the scientific and mathematical circles, the business community has been slow to adopt the trends. With the exception of financial institutions and some sales and marketing campaigns, thinking and learning machines have not made much headway. With the ubiquity and popularity of big data infrastructure, such as Hadoop, it is easy to see that the near future hold exciting trends in machine learning in the business.

Big data enables businesses to adopt machine learning technologies. The potential for machine learning as a field of study and its business applications is unlimited. There are so many problems we know, but do not know how to solve. There is a bigger list of problems that we do not even know exists, let alone know how to solve them. If we ever hope to discover these problems and solve them effectively, learning machines are our fiends.