Category Archives: Big data

In the New Digital Economy, Everything Can Be Digitized and Tracked : Now What?

Woman Buying ClothesWelcome to a world where digital reigns supreme. Remember when the Internet was more of a ‘push’ network? Today, it underpins how most people and businesses conduct transactions – providing peer-to-peer connections where every single interaction can be tracked.

Enterprises are still not taking full advantage. With hundreds of millions of people connected, it’s possible for them to connect their suppliers with their customers and their payment systems, and reach the holy grail of seamlessly engaging in commerce, where a transaction can be tracked from purchase, to order received, to manufacturing, through to shipment— all in real time. It’s clear that end-to-end digitization delivers enormous potential, but it has yet to be fully tapped by most companies.

In the latest #askSAP Analytics Innovations Community Webcast, Reimagine Predictive Analytics for the Digital Enterprise, attendees were given an introduction to SAP BusinessObjects Predictive Analytics, along with some key use cases. The presentation covered native in-memory predictive analytics, deploying predictive analytics on Big Data, and how to bring predictive insight to Business Intelligence (BI).

The live, interactive call was moderated by  SAP Mentor  Greg Myers and featured expert speakers Ashish Morzaria, Global GTM Director, Advanced Analytics, and Richard Mooney, Lead Product Manager for Advanced Analytics.

The speakers noted that companies used to become leaders in their industries by establishing an unbeatable brand or by having a supply chain that was more efficient than anyone else’s. While this is still relevant in the digital economy, companies now have to think about how they can turn this new digital economy to their advantage. One of the keys is turning the digital economy’s key driver —the data— to their advantage.

Companies embracing digital transformation are outperforming those who aren’t. With predictive analytics, these companies can use historical data to predict behaviors or outcomes, answer “what-if” questions, and ensure employees have what they need to make optimized decisions. They can fully leverage customer relationships with better insight, and make meaningful sense of Big Data.

One big question delved into during the call: How can companies personalize each interaction across all channels and turn each one into an advantage? The answer: By getting a complete digital picture of their customers and applying predictive analytics to sharpen their marketing focus, optimize their spend, redefine key marketing activities, and offer product recommendations tailored to customers across different channels.

Real-World Customer Stories

The call also focused on some real-world examples of customers achieving value by using and embedding predictive analytics in their decisions and operations, including Cox Cable, Monext, M-Bank, and Mobilink.

These companies have been able to improve performance across thousands of processes and decisions, and also create new products, services, and business models. They’ve squeezed more efficiencies and margins from their production assets, processes, networks, and people.

One key takeaway is the importance of using algorithms, as they provide insights that can make a business process more profitable or competitive, and spotlight new ways of doing business and new opportunities for growth.

The speakers also presented a very detailed customer case study on Harris Logic. The company is using SAP BusinessObjects Predictive Analytics for automated analytics and rapid prototyping of their models. They execute models into SAP HANA for real-time predictions using a native, logistical regression model. This approach is allowing for the identification of key predictors that more heavily influence a behavioral health outcome.

Learn More

Lots of food for thought. See what questions people were asking during the webcast and get all of the answers here. Check out the complete presentation, and continue to post your questions and watch for dates for our upcoming webcast in the series via Twitter using #askSAP.

AmickBrown.com

SAP Business Suite 4 SAP HANA – Let’s Start at the Beginning

by Ashith Bolar, Director AmBr Labs, Amick Brown

Every week at Amick Brown, we are questioned about HANA There is a lot of confusion in the market with the multiple options. As well, there are many questions about timing and business application. You have asked, so we will start a series of HANA articles to address your questions.

grow blue suit

SAP Business Suite 4 SAP HANA, shortened to SAP S/4HANA,  is a big strategic play from SAP. Here is why you need to take heed.

The new SAP S/4HANA is supposed to replace the SAP Business Suite (formerly R/3) over the next few years. This announcement and the launch of the software lay a roadmap for SAP in the coming years.

What led to this launch?

SAP is a leader in ERP worldwide. However, in the recent past, a new trend is taking over in the business world. Cloud-based software services also known as Software-as-a-Service. SAP has SaaS components to it, but its main business model has been selling software the old way: software installed at the customers’ premise.

Other cloud companies  have been slowly chipping away at SAP’s market share. And this is SAP’s answer.

Name

The R in R/3 stood for real-time. The S in the S/4 stands for Simple. This is the big idea. SAP is planning on simplifying the ERP system with this release.

Database

While SAP R/3 Business Suite ran on any database, S/4 runs exclusively on HANA. SAP has spent considerable financial resources and effort on building up the in-memory database over the past few years. SAP HANA has tremendous performance advantages compared to the older disk-based database solutions. This large-scale change has enabled SAP to dramatically simplify both the data-model as well as the user-experience.

One significant aspect of HANA is that it is an in-memory appliance. This means data-access times (disk read/writes) are not an issue anymore, allowing developers to focus more on business logic than performance. This lends itself to the other motivation for S/4 – simplicity.

The Cloud

SAP S/4HANA is mostly a movement of SAP’s premier software from customer premise to the cloud. However, on-premise solutions will still be available. SAP offers 3 options:

  1. Public Cloud – Completely managed by SAP. Multi-tenancy shared by all public cloud customers
  2. Private Cloud – Partially managed by SAP. Exclusive database per customer.
  3. On-Premise – Software installed on client’s hardware. Client pays for user-licenses.

Software

SAP S/4HANA will allow customization to S/4HANA on the HANA Cloud Platform (HCP). This means ABAP developers will get to continue to use their skills. If you don’t know OO, it is a good time to learn it.

UI

Let’s admit it, SAP R/3 has not been known for its stellar user-experience. UI on SAP R/3 has been clunky, rigid and unwelcoming. But the S/4HANA user-interface will be based on SAP’s Fiori UX platform. SAP Fiori, launched earlier in 2014, gives the software a new look-and-feel. The fact it does not have licensing cost should make it attractive to customers with an existing SAP installation.

Conclusion

Co-founder, Hasso Plattner said “If this doesn’t work, we’re dead. Flat-out dead.” This may be just Hasso Plattner being the passionate visionary that he is. But this indeed is a huge launch from SAP, one whose initial roll out is expected to be 3-5 years, and customer transitions lasting more 10 years.

The story on S/4 HANA continues here.  Watch this space and Follow Amick Brown on LinkedIn

Reimagine Predictive Analytics for the Digital Enterprise

future_predictive_analytics_SAPPHIRENOW

As part of a broad announcement made at SAPPHIRE NOW 2016, SAP announced a range of new features and capabilities in its analytics solutions portfolio. Because predictive capabilities play an important role in the portfolio, I thought I’d take this opportunity to share the details of our innovations in both SAP BusinessObjects Cloud and SAP BusinessObjects Predictive Analytics.

Innovations in SAP BusinessObjects Cloud

Predictive analytics capabilities have been added to the SAP BusinessObjects Cloud offering. Business users can use an intuitive graphical user interface to investigate business scenarios by leveraging powerful built-in algorithmic models. For example, users can perform financial projections with time series forecasts, automatically identify key influencers of operational performance, and determine factors impacting employee performance with guided machine discovery.

Learn more about our predictive capabilities in SAP BusinessObjects Cloud.

Innovations in SAP BusinessObjects Predictive Analytics

Predictive analytics features that aim to help analysts easily deliver predictive insights across an enterprise’s business processes and applications are planned for availability in the near term.

Planned innovations include:

  • Automated predictive analysis of Big Data with native Spark modeling in Hadoop environments
  • Enhancements for SAP HANA including in-database social network analysis and embedding expert model chains
  • A new simplified user interface for the predictive factory and automated generation of segmented forecast models
  • Integration of third-party tools and external processes into predictive factory workflows
  • The ability to create and manage customized models that detect complex fraud patterns for the SAP Fraud Management analytic application

Learn more about what SAP Predictive Analytics has in store.

Upcoming Release of SAP Predictive Analytics

Watch the video about our upcoming release of SAP Predictive Analytics for more information.

Thank you to Pierre Leroux, Director, Predictive Analytics Product Marketing, SAP for writing this informative article.

AmickBrown.com


Predictive Analytics and the Segment of One

by Richard Mooney,                                           Product Manager, Advanced Analytics, SAP


Woman Buying Clothes --- Image by © Tim Pannell/CorbisOne of the areas that SAP is investing heavily in is the idea of providing ‘extreme customer experience’ to the ‘Segment of One.’  What does this mean for analytics? Traditionally, large enterprises split customers into multiple segments based on customer attributes that were then used to identify and classify customers.  These segments included their location, their current and potential spend, and which products and options they chose when they became a customer.

Marketers use these segments to determine which products they would market to which customers. Likewise, customer support applies different levels of service to each customer segment, and operations measures the profitability of each segment separately.

This is both highly frustrating to customers and an incredibly inefficient use of resources.

  • Every customer is different. They feel frustrated when their individual needs aren’t met, and their expectations about how they’re treated as customers are rising.
  • A one-size-fits-all approach doesn’t take into account the emerging customer acquisition and support channels that provide the potential to reduce the cost of service and market much more effectively. This includes mobiles applications, social networks, and the internet of things.
  • Because the cost of customer communication is plummeting, customers are inundated with content. They’re choosing to delete, unfollow and unsubscribe from content that doesn’t speak to them.

These same trends are opportunities. Companies are collecting far more information than ever before and the technology exists to leverage this at scale.  They no longer need to treat customers as being pure segments.  They can market to them personally, understand their likes and preferences, and give them services, all of which turns them into fans and advocates.

So How Do We Use Data to Connect to the Segment of One?

  • Make the Segment of One a corporate mandate. Communicate and service each customer as if it were a personal connection.
  • Rethink how your digital front office assets (including digital marketing, customer service and online) interact with customers to support this mandate.
  • Build a team of data scientists and data analysts to move from guesswork to data-driven decision making.
  • Build your customer communication around their analysis and deploy their work into every front office application. Measure and monitor the return on investment (ROI) from each initiative.

Done properly, this will result in happier customers and higher net promoter scores.   It also means that the data companies are collecting results in visible ROI, which improves their bottom line.

We would love to hear your thoughts on how the Segment of One will drive your data strategy.  Contact us or comment here to let us know.


Customer Analytics – Predictive at the Center of Everything You Do

crystal-ballAs we discussed earlier, digital transformation is about taking a holistic approach to transforming the customer experience in all aspects. In this way, you fundamentally create new business models where the convergence of physical and digital occurs at the highest level.

In today’s quickly changing and evolving digital marketplace, there are a few macro trends that you see.  The purchase path is not linear, customer engagement occurs through many touch points, and customers expect each interaction to be relevant and personalized.

The rules of engagement are changing and businesses are no longer the first stop for customers when they want to inform themselves.  People now turn to their networks to get information and recommendations. To meet the expectations of your customers today, you need to go beyond the traditional approach of acquiring and retaining customers.

The goal today is to deliver an amazing customer experience at every interaction so that you not only acquire and retain customers, but you also gain  customers who become your loyal fans, your outspoken advocates. This all boils down to the fundamental question,

How can I personalize every customer interaction across multiple channels in real time by analyzing Big Data?

This leads to transforming the operating models to a more customer-centric, integrated organization using data and analytics as the basis for decision making. The transformation can be started with very simple questions:

  • Who are my “best” customers?
  • Who should I target for promotion?
  • How should I vary my promotion to different customers?
  • What product should I sell at what channel and at what price?
  • How should I keep the supply and demand in absolute balance?

A series of predictive models for each one of these questions will establish a framework to manage the customer life cycle. To achieve this, you  use a variety of techniques, such as segmentation, link analysis, propensity, forecasting and more.

What do you think? We look forward to hearing from you.

See more about Amick Brown , SAP Silver Services Partner


Predictive Analytics 101 – The Real Business Intelligence, part 2

by Ashith Bolar,  Director AmBr Data Labs @ Amick Brown

In my first post, “The Real Business Intelligence” ,  I emphasized on the significance of Predictive Analytics in the Business Intelligence space.  Let us take a deeper look at Predictive Analytics by way of more concrete examples.

As a refresher, Predictive Analytics is a set of tools and techniques based on statistical and mathematical techniques to analyze historical data and subsequently predict the future. The basic premise is that by analyzing historical data, determining relationships, more specifically correlations between related (and sometimes seemingly unrelated) attributes and entities, one can derive significant insights into a system. These insights can be further used to make predictions.

Let’s take a look at this process step by step.

The fundamental component in Predictive Analytics is a Predictive Model, or just model. A Predictive Model is set of data points plus a series of algorithms working on that data. It attempts to capture the relationships between the data points by means of applying mathematical or statistical computations deployed as algorithms.

The output of a model is typically a single number — called a score. The score essentially is an quantitative value for a specific prediction by the model based on historical data. Higher the score, the more likely a certain behavior is predicted. Lower the score, the more likely the opposite behaviour is predicted.

Predictive models can be built for a wide variety of problems. But the most common predictive models, especially in the context of a business application, is one that predicts people’s behaviors. Predictive models are designed to predict how people behave under new circumstances, given what we know about how they behaved in the past with other known circumstances. For instance, Netflix’s movie recommendations — based on the movies that you have seen and rated highly (known circumstances) recommendations for new movies (unknown circumstances) are generated.

You will hear terms like “Machine Learning”, “Artificial Intelligence”, “Regression Analysis”, etc. While, each one is an independent area of mathematics and computing, for a Predictive Analytics suite, these are just different algorithms (computing models) that are employed in the process of predicting.

Let’s dig deeper into the concept of Scores. Let’s take two classical examples of scores generated on customers.

  1. Based on the movies you have seen and rated in the past, Netflix tries to determine if you will like a new movie or not. Say for instance, a scoring of 0-10: 10 being a prediction of you absolutely loving the new movie, and 0 being a prediction of you absolute not caring about it. This type of a score is called a Probability Score. In essence, the score tells you the probability of you liking a movie.
  2. Another type of score is called the Quantitative Score. Here the prediction is not the probability of whether you will like the movie or not, instead to quantitatively predict the amount of something. For instance, Life Insurance companies try to predict how long a certain customer will live based on the life choices and other circumstances of the customer.

In case of the Netflix model (Probability Score), if a customer gets a 8 (out of 10) for the likelihood of liking a particular movie, it can be rephrased as “There’s a 80% chance that the customer will like this movie, and a 20% chance that they will not like it”. Such a prediction is basing its prediction on the spread of probabilities (probability distribution). Another way of looking at this score of 8 (out of 10 is) “The customer might not absolutely love this movie (which would be a 10/10), but definitely not absolutely hate the movie (0/10). Instead the customer is more likely actually liking the movie to some extent (8/10), rather than completely disinterested (5/10).

In either case, a careful examination of this score tells us that all the system is doing is categorizing people’s behaviours into a set number of ranks. Therefore, predictive models which generate probability scores are usually called classification models. On the other hand, the quantitative scoring (predicted life expectancy of an insurance customer) is really a quantitative number. Another classic example is customer spend which is how much a customer is willing to pay for a new product or service. The actual value is reached at by means of various statistical and mathematical computations. These models are typically known as regression models.

A good predictive model might not be accurate in every single case, but given a large set of data (read target customers), the model regresses to the predicted mean of the behavior.

In the following posts, we will delve deeper into predictive algorithms, and try to gain a better understanding of how they work, and more importantly why they work, and why they are important in your corporate strategy.


“Passionate on Analytics” , new book available

from Iver van de Zand

My book “Passionate On Analytics” is available now

Driven by a deep believe of the value of business analytics and business intelligence in the era of Digital Transformation, the book explains and comments with insights, best practices and strategic advices on how to apply analytics in the best possible way. 25 Years of analytics hands-on experience come together in one format that allows any analytics userHow proud can one be?

My first book titled “Passionate on Analytics” is now available from the Apple iBooks Store via this link.

Since I am evangelizing on interactive analytics every single day, I decided to create aninteractive ePub book. It contains over 60 best practice and tutorial videos, tons of valuable links and galleries and 33 extended articles providing insights on various analytics related topics.

Passionate on Analytics (206p) has 4 sections:

  1. Insights: 13 deep dive articles on various aspects of business analytics like industry specific approaches, embedded analytics and many more
  2. Strategy: 13 chapters talking analytics strategy related subjects and topics like defining your BI roadmap or the closed loop portfolio
  3. Best Practices: 10 expert sessions showing and demonstrating best practices in business analytics like using Hitherto charts, how to make a Pareto or visualization techniques
  4. Resources: a wealth (!) of resources on analytics

Please find below some screenshots.

I am very happy with the book with has brought up the best in me. Everything I learned, experienced or discussed during my 25 years tenure in business analytics, is expressed in this book. The book is fully interactive meaning you can tap pictures for background, swipe through galleries or start an tutorial video.

Special thanks goto Ty Miller, Timo Elliott, Patrick Vandeven and Waldemar Adams who I all admire a lot.

Iver


Artificial Intelligence meets Business Intelligence

By Ashith Bolar, Director of Research, Amick Brown

It’s bound to happen:  Artificial Intelligence (AI) will meet Business Intelligence (BI). In fact, in several places, it has already happened. But let’s take some time to see how this convergence is progressing, if at all.

The first decade of the 21st century was all about Business Intelligence. Towards the end of the decade, big strides were made to harness the explosion of Big Data. The second decade has been mostly about fuelling Business Intelligence with the Big Data. Several companies, large and small, have been making very impressive strides in this direction. However, there is still a lot of room for improvements.

On the other side in the world of computing, Artificial Intelligence has been making slow inroads in all aspects of life. In the last 15 years, AI has been creeping up into our personal lives with applications such as Siri, the entire Google ecosystem, and a myriad of social networking applications. All of this is happening without us realizing the amount of AI happening behind the scenes. Artificial Intelligence has moved out of the academic realm towards the daily lives of consumers.

Much of the business community associates AI with machine learning algorithms. While that’s true, it leaves much of AI underappreciated for its real capacity in Business Planning and Data Analytics. There is more to AI than just recommending your next movie on Netflix and making Google give you better results on your web search.

There are several applications and platforms that transform and summarize a corporation’s big data. However, ultimately it’s the humans that consume this summary of data, to make decisions based on higher human intelligence. I argue that this will change over the next decade. If history is any indication of how accurate our predictions of coming technological revolutions are, I would imagine this transformation will happen much sooner than a decade.

Most of us know Big Data and the Internet of Things that has enabled this explosion. Big Data infrastructure does much of the heavy lifting of cleaning up, harmonizing, and summarizing this data. However, the actual process of deriving intelligence and insights is still within the human realm.

Inevitably, the future of Business Intelligence goes hand in hand with Artificial Intelligence.

The new wave of BI software should be able to perform the basics of building data analytics models without human intervention. These systems should be able to generate hundreds of models overnight. The next step is to build systems that not only generate redundant set of models, but also identify the good models – ones that model reality accurately – and weed out the bad models. The third wave of solutions will be the ones that make a majority of decision making for a company.

In the coming posts, we will explore in more details some of the initial attempts of converging Artificial Intelligence and Business Intelligence.

Data Driven Decisions improve your business

Fact Based Decision Making

For many companies the first reporting and analytics question that they ask is, “What specific items should my company measure?” However, what you measure should be based on how to get results from your data that make measurable change in the organization. The first question really is, “What are my business goals and what measurable components can help me achieve or miss this goal?

Decision Man

Some examples are:

  1. Churn reduction
  2. Retirement possibilities in the next year.
  3. Employees that leave in less than a year
  4. Departments with the highest attrition
  5. Supply chain service improvement
  6. JIT miscalculations by department or location
  7. Customer service complaints, late deliveries to customers
  8. Staffing variations and what affect this has on production 

Why fact based is important…

Another huge common occurrence in the reporting world is decisions made without trackable, measureable fact. Unbelievably, companies still make decisions with historical process, experience, and their “gut” to some degree.

With the availability of big data, your competitors are not only going to have access to information about themselves, but also about your customers and your ability to perform. If this data is not used well by your company – you will lose business.

So how exactly does your company aggregate data, produce reports, or glean insight to meet goals? If you are like the vast majority of companies out there, it is a big data dump into a spreadsheet that is picked through and interpreted by the individual who requested it.

Many have very slick Reporting solutions, but they are not leveraging them to the full potential – not by a long shot. Why is this? The pervasive gaps are that people are creatures of habit and continue to want to report like they have always done and change management/training is not factored in. The poor IT Manager put in charge of the BI project is inundated with data dump requests and help requests on-going.

Circling back to Data Driven Decisions, the very first things that must be carefully and completely determined are:

  1. What are the challenges that prevent me/my company from beating the competition, increasing revenue, operating smoothly, etc?
  2. What people drive the resolution of these challenges?
  3. What data and report metrics do these users need to show the golden road to overcoming the challenges?

Beginning with what decisions need to be made, which people will drive goal attainment, then what data and metrics will roll up to an answer – the first big hurdle to Business Intelligence success will have been overcome.

For more on this subject, watch this space… blogs.amickbrown.com/ 


Thinking Machines – Part 3

This is the third and last installment of a 3-part series on machine learning. If you want to read the first two parts, follow the links below. The outline of the 3 installments is:

  1. Machine Learning Introduction
  2. Various implementations of machine learning
  3. Impact to business of machine learning computers

In the last two posts, we explored the idea of Machine Learning and its application. This post will be about how learning machines, and computers in general, impact and influence businesses and vice versa.

Humans and machine have had symbiotic relationships. While humans shape machines, the irony is that machines have shaped humans just as much as, if not more. I don’t mean it literally, but machines may be seen to have influenced human progress in the political, social and most importantly economic systems to their current state of the art. Science and technology has been the center-stage of philosophical discourse in the Western hemisphere for more than three centuries. And computers have been the engine behind the economic success of the past few decades.

While it may be argued that the era of machines began either with the start of the Industrial age, or later at the Machine age, in the context of this post it really didn’t begin until the 1890 US Census. Herman Hollerith’s punched cards and the tabulating machine essentially cut down the census time from 8 years to 1 year.

“[Hollerith’s] system made it possible for one Census Bureau employee to compute each day the data on thousands of people, keypunching information that had been captured by tens of thousands of census takers.”

Library of Congress

http://memory.loc.gov/cgi-bin/query/r?ammem/mcc:@field(DOCID+@lit(mcc/023))

If a rudimentary computer by today’s standards can shave off 7 years, then imagine the time-savings today’s computers can provide. Of course, this tremendous positive impact is not without its negatives. This automated system measurably replaced thousands of Census Bureau employees overnight.

Since then, there has been a steady employment of computing machines replacing humans. After the end of the Second World War, ENIAC and UNIVAC paved the path for electronic computers to dominate business computation.

The business of running business has been transformed by newer and more powerful electronic computers. Again, as in the US Census case, while the economic sector has reaped the benefits the labor market saw the most negative disruption in this new world.

In the first wave of these computers, the world saw the low-skilled jobs vanish. Jobs that required repetitive tasks, especially ones that involve computations on large sets of numeric data, were slowly transitioned to automation. People holding jobs that can be described as routine and codifiable were the first to see the door. While in the early part of the 20th century, the job market was dominated by low-skilled workers, a constant decline in this class of jobs can be directly attributable to computers.

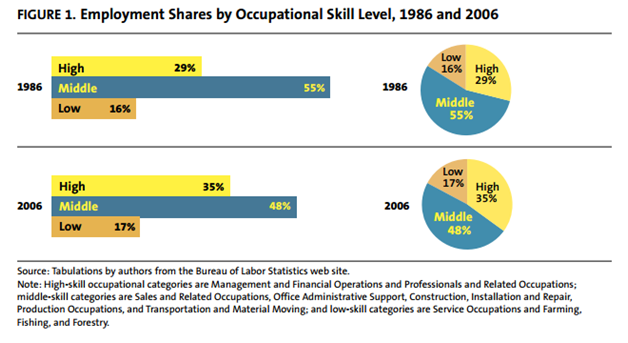
However, another trend that has caught the eye of the economists and policy makers is called the Polarization of the job market. Wikipedia describes it as “when middle-class jobs—requiring a moderate level of skills, like autoworkers’ jobs—appear to disappear relative to those at the bottom, requiring few skills, and those at the top, requiring greater skill levels.” As this chart depicts (by Harry Holzer and Robert Lerman [http://www.urban.org/UploadedPDF/411633_forgottenjobs.pdf]), while there has been a modest (and insignificant) growth in low-skilled jobs, there has been a constant decline in mid-level jobs – from 55% of all jobs in 1986 to 48% in 2006. What is notable is that the loss in mid-level skills is mostly offset by growth in high-skilled jobs.

laborstatistics

http://www.urban.org/UploadedPDF/411633_forgottenjobs.pdf

It is clear that technology and automation has caused a good deal of increase in wealth and prosperity. However, economists such as Joseph Stiglitz and Thomas Picketty have eloquently and persuasively argued that the problem is that the gain in wealth is concentrated in a relatively small number of participants in the economic system. Drawing from the experiences from the past, a policy dedicated to public and private investment in education and specialized skills training to the impacted masses is advised.

Having stated that the threat to low-skilled and mid-skilled labor categories is imminent, it seems to me that there is complacency on the high-skilled labor category. The general consensus is that high-skilled jobs will continue its strong growth. While I don’t argue that this consensus is wrong, one should, however, employ caution in prophesies such as these. Computers are increasingly doing tasks that had once been deemed impossible to be automated. Let’s take a look at some examples, where smart machines are doing high-skilled jobs.

Robojournalism

A surprising amount of what we read in newspapers and journals are actually written by computers with no human aid. Robojournalism was brought to people’s attention by “Quakebot”, a program written by Ken Schwencke. Quakebot wrote the first news article about the Mar-2014 earthquake off the Pacific Coast. This was not the first time a computer was employed to write news posts. But since then, robojournalism has gained momentum. Soon after, Associated Press announced that “the majority of U.S. corporate earnings stories for our business news report will eventually be produced using automation technology.” AP and Yahoo use a program called Wordsmith, developed by Automated Insights.

A particularly interesting case study is that of a Chicago-based company called Narrative Science They developed a piece of software called “Quill”, and similar to the earlier examples, this is a Natural Language Generator (NLG) platform that can process data, mostly in numerical format, and convert it into perfectly written narratives to be consumed by humans. Narrative Science started off by commercializing a research project at Northwestern University. It was first adopted to be used by sports channels and websites to report headlines for baseball games. It did so just by looking at the numbers. Take a look at this text that Quill generated:

Tuesday was a great day for W. Roberts, as the junior pitcher threw a perfect game to carry Virginia to a 2-0 victory over George Washington at Davenport Field.

Twenty-seven Colonials came to the plate and the Virginia pitcher vanquished them all, pitching a perfect game. He struck out 10 batters while recording his momentous feat. Roberts got Ryan Thomas to ground out for the final out of the game.

http://deadspin.com/5787397/we-heard-from-the-robot-and-it-wrote-a-better-story-about-that-perfect-game

This is an excerpt straight from Quill – no human literary intervention. This is just by parsing the box score of the game.

Narrative Science has taken this to the market to have their software write narratives for financial reports, etc.

Automatic Statistician

Big Data has generated a renewed interest in data analysis, especially applying statistical concepts to data in order to derive insights and meaning from large swaths of raw data. People calling themselves data scientists are popping up everywhere. Their main job is to take a deep look at the data (perform statistical analysis and modeling on it) and identify patterns and insights in it. These patterns and insights are valuable in predictive analytics as well as operations research. Automatic Statistician is purportedly in the business of automating this process of discovery.

Automatic Statistician is the brainchild of Zoubin Ghahramani and his research team at the Department of Engineering – University of Cambridge. They set out to make a computer do what a Data Scientist is paid to do – make sense of data. Automatic Statistician gained recognition outside the academic circles when Google awarded the team the Google Focused Research Award. At the writing of this post, Automatic statistician is still in its early stages. Yet it has shown strong potential in applying statistical and machine learning methods on raw data, and automatically discovering trends in data; completely unsupervised.

Below is the screenshot of the automatic analysis and report by Automatic Statistician, when fed the raw data of unemployment figures

automaticstatistician

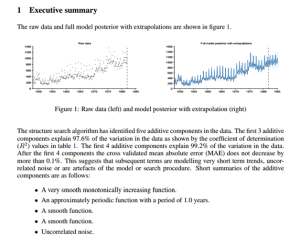
http://www.automaticstatistician.com/abcdoutput/11-unemployment.pdf

There are scores of interesting examples such as these. Machine Learning has been gaining momentum over the past decade. To repeat Ken Jennings’ sentiment: I, for one, welcome our new computer overlords.

Conclusion

Technological innovation has been reshaping the labor market for a long time now. One can date it back to the industrial revolution. For all the buzz the phrase “Big Data” has created in the recent past, I believe the advancement in AI, Robotics and Machine Learning, applied to big data is one such wave – one that will change the way we are used to do things. Many jobs from today will not exist in the near future, and many jobs in the near future are completely unknown right now. Phone operators didn’t exist for most of 18th century and neither did rocket scientists until the early 20th. Web-developers and computer network analysts didn’t exist for most of the 20th century.  Big Data, AI and Machine Learning will lead to jobs that we just cannot imagine at this time.

Sure, this disruptive technology is going to negatively impact the labor market, but there is more to gain. Technology is a net job-creator. However, to mitigate the short term negative impact, a strong role from both the government and private sector is prescribed by policy experts and economists.

Computers in business are not just about making machines do the drudgery that we do not want to do. Today’s computers are much smarter – they can simulate thinking and reasoning that was previously thought of as a purely human endeavor. Today’s computers help us strategize, perform market analysis, build modes, and explore new opportunities. Tomorrow’s thinking machines will not just be helping us, but modeling these themselves, in an unsupervised way.