For many companies the first reporting and analytics question that they ask is, “What specific items should my company measure?” However, what you measure should be based on how to get results from your data that make measurable change in the organization. The first question really is, “What are my business goals and what measurable components can help me achieve or miss this goal?
Some examples are:
Churn reduction
Retirement possibilities in the next year.
Employees that leave in less than a year
Departments with the highest attrition
Supply chain service improvement
JIT miscalculations by department or location
Customer service complaints, late deliveries to customers
Staffing variations and what affect this has on production
Why fact based is important…
Another huge common occurrence in the reporting world is decisions made without trackable, measureable fact. Unbelievably, companies still make decisions with historical process, experience, and their “gut” to some degree.
With the availability of big data, your competitors are not only going to have access to information about themselves, but also about your customers and your ability to perform. If this data is not used well by your company – you will lose business.
So how exactly does your company aggregate data, produce reports, or glean insight to meet goals? If you are like the vast majority of companies out there, it is a big data dump into a spreadsheet that is picked through and interpreted by the individual who requested it.
Many have very slick Reporting solutions, but they are not leveraging them to the full potential – not by a long shot. Why is this? The pervasive gaps are that people are creatures of habit and continue to want to report like they have always done and change management/training is not factored in. The poor IT Manager put in charge of the BI project is inundated with data dump requests and help requests on-going.
Circling back to Data Driven Decisions, the very first things that must be carefully and completely determined are:
What are the challenges that prevent me/my company from beating the competition, increasing revenue, operating smoothly, etc?
What people drive the resolution of these challenges?
What data and report metrics do these users need to show the golden road to overcoming the challenges?
Beginning with what decisions need to be made, which people will drive goal attainment, then what data and metrics will roll up to an answer – the first big hurdle to Business Intelligence success will have been overcome.
This is a first conversation based on what I am hearing in the market. There will be more to come, and I want your thoughts please. Let’s make a difference.
Top Three Hurdles to Successful Reporting and Analytics
The challenge of useful, powerful, and appreciated Business Intelligence is felt across industries, departments, and roles. By using BI well, you will position yourself to beat your competition. If you do not use the data available to drive business decisions and goal attainment, you position your competitors to win – because they ARE leveraging their data.
What is the definition of successful Business Intelligence?
My best practices definition is “Success is measured by the ability of the right people, to use the right data, and create usable reports that aid in business goal attainment”.
Sounds simple, right? Well it will be with planning, understanding and buy-in from users at all levels. It is truly a change management issue as well as a technology issue. IT will drive the technology side, but must work hand in hand with the various business leaders to develop outcomes that make a difference in efficiency, process, and profitability.
The Top 3 Hurdles to BI Success:
“Give me all of the data and I will figure out what I need”
Users, Managers, and Executives do not realize the depth of business case resolution that their data can provide. The approach tends to be, “give me all of the data and I will figure out what I need and want to use.” Inherently, this is manufacturing the outcome instead of letting it manifest organically.
Tied closely to this request is the real situation that people do not like change. They “have always done it this way” is a first cousin to the data dump method. Overcoming a historic process can be harder than learning how to use BI well.
With the powerful BI tools available, dashboards and reports can be targeted to achieve business success. These successes will be defined by each leader based on corporate goals. The tough part comes in taking a measurable goal and allowing the solution to mine the data from various sources to provide accurate reports from which to make decisions. Long story short – is the report authentic and actionable.
“My data is a mess ! “
How many times have I heard that reporting and analytics is a moot point because the data flowing in has not been cleansed or integrated in years. Well then, we know where to start because this statement is true. Garbage in is garbage out.
So, this hurdle to BI success becomes part of the solution. Regardless of how simple the reporting and analytics outputs are, their foundation must be in valid data.
Housekeeping is essential – so the longer cleaning the house is put off, the dirtier it will get.
One and done is not an option
Let’s look at a very common situation: When the shiny new “box” of BI software came – the enthusiasm was real. Users throughout the company were vested and interested in the cool reports that they would be able to generate. Well, that was 8 years ago. Hopefully much has changed in your business since then. The reports, however, have not changed. You are measuring and dwelling on 8 year old business challenges. This is definitely not effective.
A proactive sustainability plan will separate the average performing BI users from the rock stars. Incorporate this into your reporting and analytics plan!
YES – THIS IS PURPOSELY REPEATED – IT’S IMPORTANT
This is a first conversation based on what I am hearing in the market. There will be more to come, and I want your thoughts please.
The challenge of useful, powerful, and appreciated Business Intelligence is felt across industries, departments, and roles. By using BI well, you will position yourself to beat your competition. If you do not use the data available to drive business decisions and goal attainment, you position your competitors to win – because they ARE leveraging Big Data.
This is the third and last installment of a 3-part series on machine learning. If you want to read the first two parts, follow the links below. The outline of the 3 installments is:
In the last two posts, we explored the idea of Machine Learning and its application. This post will be about how learning machines, and computers in general, impact and influence businesses and vice versa.
Humans and machine have had symbiotic relationships. While humans shape machines, the irony is that machines have shaped humans just as much as, if not more. I don’t mean it literally, but machines may be seen to have influenced human progress in the political, social and most importantly economic systems to their current state of the art. Science and technology has been the center-stage of philosophical discourse in the Western hemisphere for more than three centuries. And computers have been the engine behind the economic success of the past few decades.
While it may be argued that the era of machines began either with the start of the Industrial age, or later at the Machine age, in the context of this post it really didn’t begin until the 1890 US Census. Herman Hollerith’s punched cards and the tabulating machine essentially cut down the census time from 8 years to 1 year.
“[Hollerith’s] system made it possible for one Census Bureau employee to compute each day the data on thousands of people, keypunching information that had been captured by tens of thousands of census takers.”
If a rudimentary computer by today’s standards can shave off 7 years, then imagine the time-savings today’s computers can provide. Of course, this tremendous positive impact is not without its negatives. This automated system measurably replaced thousands of Census Bureau employees overnight.
Since then, there has been a steady employment of computing machines replacing humans. After the end of the Second World War, ENIAC and UNIVAC paved the path for electronic computers to dominate business computation.
The business of running business has been transformed by newer and more powerful electronic computers. Again, as in the US Census case, while the economic sector has reaped the benefits the labor market saw the most negative disruption in this new world.
In the first wave of these computers, the world saw the low-skilled jobs vanish. Jobs that required repetitive tasks, especially ones that involve computations on large sets of numeric data, were slowly transitioned to automation. People holding jobs that can be described as routine and codifiable were the first to see the door. While in the early part of the 20th century, the job market was dominated by low-skilled workers, a constant decline in this class of jobs can be directly attributable to computers.
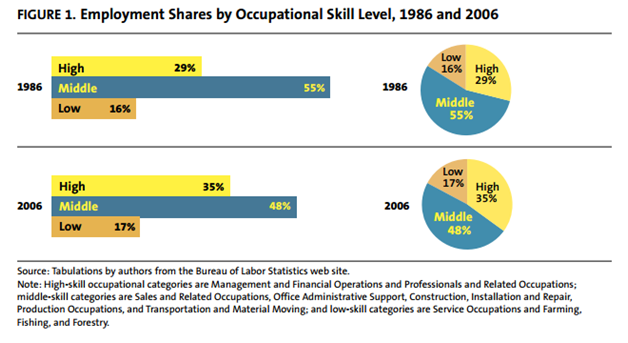
However, another trend that has caught the eye of the economists and policy makers is called the Polarization of the job market. Wikipedia describes it as “when middle-class jobs—requiring a moderate level of skills, like autoworkers’ jobs—appear to disappear relative to those at the bottom, requiring few skills, and those at the top, requiring greater skill levels.” As this chart depicts (by Harry Holzer and Robert Lerman [http://www.urban.org/UploadedPDF/411633_forgottenjobs.pdf]), while there has been a modest (and insignificant) growth in low-skilled jobs, there has been a constant decline in mid-level jobs – from 55% of all jobs in 1986 to 48% in 2006. What is notable is that the loss in mid-level skills is mostly offset by growth in high-skilled jobs.
It is clear that technology and automation has caused a good deal of increase in wealth and prosperity. However, economists such as Joseph Stiglitz and Thomas Picketty have eloquently and persuasively argued that the problem is that the gain in wealth is concentrated in a relatively small number of participants in the economic system. Drawing from the experiences from the past, a policy dedicated to public and private investment in education and specialized skills training to the impacted masses is advised.
Having stated that the threat to low-skilled and mid-skilled labor categories is imminent, it seems to me that there is complacency on the high-skilled labor category. The general consensus is that high-skilled jobs will continue its strong growth. While I don’t argue that this consensus is wrong, one should, however, employ caution in prophesies such as these. Computers are increasingly doing tasks that had once been deemed impossible to be automated. Let’s take a look at some examples, where smart machines are doing high-skilled jobs.
Robojournalism
A surprising amount of what we read in newspapers and journals are actually written by computers with no human aid. Robojournalism was brought to people’s attention by “Quakebot”, a program written by Ken Schwencke. Quakebot wrote the first news article about the Mar-2014 earthquake off the Pacific Coast. This was not the first time a computer was employed to write news posts. But since then, robojournalism has gained momentum. Soon after, Associated Press announced that “the majority of U.S. corporate earnings stories for our business news report will eventually be produced using automation technology.” AP and Yahoo use a program called Wordsmith, developed by Automated Insights.
A particularly interesting case study is that of a Chicago-based company called Narrative Science They developed a piece of software called “Quill”, and similar to the earlier examples, this is a Natural Language Generator (NLG) platform that can process data, mostly in numerical format, and convert it into perfectly written narratives to be consumed by humans. Narrative Science started off by commercializing a research project at Northwestern University. It was first adopted to be used by sports channels and websites to report headlines for baseball games. It did so just by looking at the numbers. Take a look at this text that Quill generated:
Tuesday was a great day for W. Roberts, as the junior pitcher threw a perfect game to carry Virginia to a 2-0 victory over George Washington at Davenport Field.
Twenty-seven Colonials came to the plate and the Virginia pitcher vanquished them all, pitching a perfect game. He struck out 10 batters while recording his momentous feat. Roberts got Ryan Thomas to ground out for the final out of the game.
This is an excerpt straight from Quill – no human literary intervention. This is just by parsing the box score of the game.
Narrative Science has taken this to the market to have their software write narratives for financial reports, etc.
Automatic Statistician
Big Data has generated a renewed interest in data analysis, especially applying statistical concepts to data in order to derive insights and meaning from large swaths of raw data. People calling themselves data scientists are popping up everywhere. Their main job is to take a deep look at the data (perform statistical analysis and modeling on it) and identify patterns and insights in it. These patterns and insights are valuable in predictive analytics as well as operations research. Automatic Statistician is purportedly in the business of automating this process of discovery.
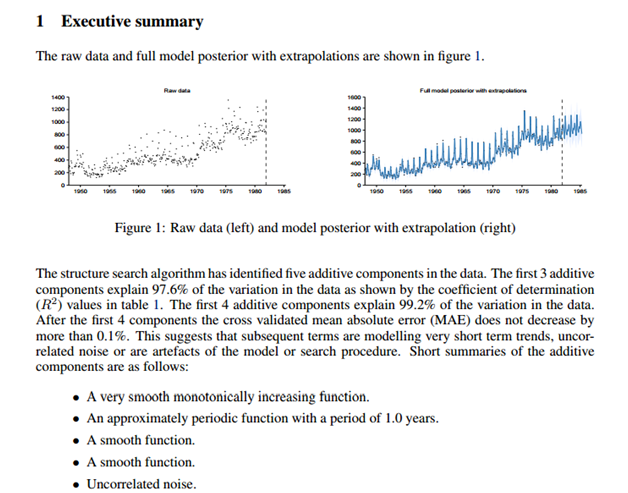
Automatic Statistician is the brainchild of Zoubin Ghahramani and his research team at the Department of Engineering – University of Cambridge. They set out to make a computer do what a Data Scientist is paid to do – make sense of data. Automatic Statistician gained recognition outside the academic circles when Google awarded the team the Google Focused Research Award. At the writing of this post, Automatic statistician is still in its early stages. Yet it has shown strong potential in applying statistical and machine learning methods on raw data, and automatically discovering trends in data; completely unsupervised.
Below is the screenshot of the automatic analysis and report by Automatic Statistician, when fed the raw data of unemployment figures
There are scores of interesting examples such as these. Machine Learning has been gaining momentum over the past decade. To repeat Ken Jennings’ sentiment: I, for one, welcome our new computer overlords.
Conclusion
Technological innovation has been reshaping the labor market for a long time now. One can date it back to the industrial revolution. For all the buzz the phrase “Big Data” has created in the recent past, I believe the advancement in AI, Robotics and Machine Learning, applied to big data is one such wave – one that will change the way we are used to do things. Many jobs from today will not exist in the near future, and many jobs in the near future are completely unknown right now. Phone operators didn’t exist for most of 18th century and neither did rocket scientists until the early 20th. Web-developers and computer network analysts didn’t exist for most of the 20th century. Big Data, AI and Machine Learning will lead to jobs that we just cannot imagine at this time.
Sure, this disruptive technology is going to negatively impact the labor market, but there is more to gain. Technology is a net job-creator. However, to mitigate the short term negative impact, a strong role from both the government and private sector is prescribed by policy experts and economists.
Computers in business are not just about making machines do the drudgery that we do not want to do. Today’s computers are much smarter – they can simulate thinking and reasoning that was previously thought of as a purely human endeavor. Today’s computers help us strategize, perform market analysis, build modes, and explore new opportunities. Tomorrow’s thinking machines will not just be helping us, but modeling these themselves, in an unsupervised way.
This is the second installment of a 3-part series on machine learning. If you want to read the first part, the link is below. The outline of the 3 installments is:
The last installment will be published in the next few weeks. I will update this article with a link to it.
In the last post, we outlined the basic underpinnings of Machine Learning in the context of Big Data. Here we shall examine some implementations of Machine Learning, a discipline that stemmed from research into Artificial Intelligence (AI), especially concerning algorithms that learn from the data autonomously. In this post, let’s look at some AI machines programmed to perform machine learning, and their fascinating results and occasionally surprising side-effects. Although the focus is on machine learning, the mechanics themselves belong to a broader context of AI.
Deep Blue
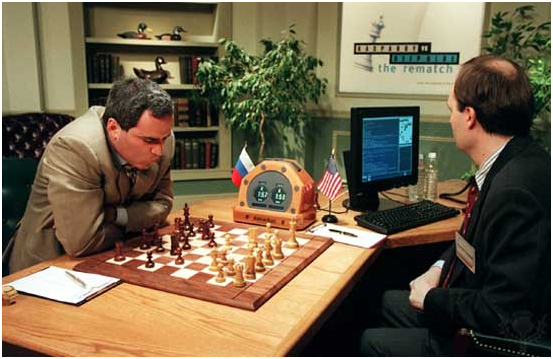
On February 10, 1996, a computer called Deep Blue beat a human at a game of chess. What was historic about this was the fact that the human was the reigning world chess champion, Gary Kasparov. Although, eventually Kasparov went on the beat the computer, it was the beginning of the end of human dominance in this extremely strategy-based board game.
Then in May 1997, the same computer after several upgrades played Kasparov again. This time the computer beat Kasparov 2-1 in a 6-game tournament. If there was any debate that a computer cannot beat the best human in a game of chess, this put an end to it. Or did it?
Deep blue is just as fascinating in what it is not, as much as in what it is. While, technically, Deep Blue’s deep knowledge of chess came from learning prior games, its super-power truly lies in its massive processing capacity. Deep Blue is a massively parallel system (technical term for a lot of processors, running in parallel), with 30 processors plus 480 chess chips. In simple English, it’s a beast. It can process nearly 300 million positions/moves per second.
That raises a question: Is Deep Blue really a learning machine? Firstly, according to the rules of the tournament, Deep Blue’s developers were allowed to alter/upgrade the software between games. This means that Deep Blue’s engineers were learning the game and teaching it to the computer, rather than the computer doing it for itself. But IBM chalks it up to upgrading the system’s learning mechanism. Fair enough.
Compare deep blue’s functioning to how a human thinks. A human gets better and better at playing chess as they play more and against better opponents. Even if IBM engineers were right in that their inter-game intervention was only upgrading, the question still is: Does deep blue understand the game of chess and its strategies the same way a human learns. I am not referring to the wetware [http://en.wikipedia.org/wiki/Wetware_%28brain%29] vs hardware/software argument. Humans obviously are not processing more than 200 million moves per second: far from it. Deep blue, on the other hand, does have this capability and uses it quite effectively. This clearly points to the difference in human insight and the brute force a computer. Deep Blue may or may not have had the same insight Kasparov had, but at the end of the day, Deep Blue won.
Source: Encyclopaedia Brittanica
Watson
For our second example of an artificially intelligent computer, we go back to IBM.
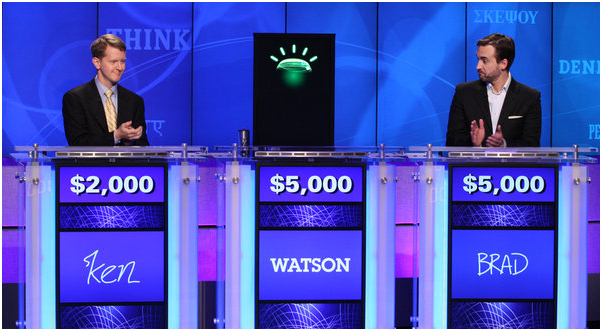
In 2011, Watson played Jeopardy! (a popular TV quiz show) with Brad Rutter and Ken Jennings, former winners of the game show. Brad Rutter never lost Jeopardy to a human opponent. Ken Jennings, of course, holds the record for the longest winning streak in Jeopady history, 73 in total. Together, these two men had walked away with more than $5 million dollars, when they played against Watson. In a 3 day tournament, Rutter and Jennings went head-to-head against Watson, only to see Watson trounce them in the end.
While crunching numbers is something computers are very good at, language processing has been a very challenging problem in computer science. IBM set out to take this challenge up, when they designed and built a computer named Watson. More specifically, Watson was exclusively designed to answer trivia questions asked in natural language.
Watson’s first task is to extract meaning from a vast database of documents, ranging from encyclopedias, news articles and literary works – millions of them. Keep in mind that this is not the same as Google’s search engine indexing the Internet. Document searching (and page ranking) is to take a keyword as query and return a list of documents that are relevant to the query. While a search engine knows the words in the indexed documents, Watson is supposed to understand the contents of the documents.
Understanding Human language is a difficult task for a computer, which thrives in a world of discrete numerical constructs. Real language is full of implicit and ambiguous references, whose meaning can only be extracted within the context of the conversation. Take for instance this phrase: “I like tea, but Java is what gets me going.” An average English speaker has no problem understanding that Java is a reference to coffee. We will be hard-pressed to find people who would mistake this java for either the computer programming language or one of the main islands in Indonesia. For a computer, on the other hand, this is a very difficult task – determining meaning by context. A compute trying to understand a phrase like “Here I am sitting in my hotel room in Java, sipping on my Java, and coding away in Java” would probably lead to a blue-screen-of-death [http://en.wikipedia.org/wiki/Blue_Screen_of_Death].
Let’s take look at how Watson discovers the right answer to a given question. Just like Deep Blue, Watson is a massively parallel computer: one built with a cluster of 90 IBM Power 750 servers, each one powered by an 8-core processor. All added up, Watson had 2,880 POWER7 processor cores and 16 tBs of RAM. Watson ran on SUSE Linux Enterprise Server OS using Apache Hadoop’s distributed computing framework.
On this infrastructure, Watson ran IBM’s DeepQA software, a software designed to run on massively parallel infrastructure. The mechanism with which this computer turned trivia questions is as impressive as the hardware and software it ran on.
Watson firstly, accumulated a vast amount of knowledge by storing and indexing millions of documents. When Watson received a question, it would first perform a task called “Question decomposition,” where it would break down and parse the question/clue into keywords and phrasal fragments. It would then run several natural language analysis algorithms on the decomposed question phrases, all in parallel. The more algorithms that return with the same answer, the more confident Watson becomes of that answer. These two steps were “hypothesis generation” and “evidence scoring.” Based on this scoring, Watson would then rank the hypotheses. Together, score and rank, helped Watson determines the “confidence” it had in the answer. When the confidence is high enough, Watson would buzz the answer.
Jennings and several experts in the field of neuroscience and artificial intelligence are convinced that this is very similar to how a human brain works, under the same circumstances.
Answering Trivia might sound trivial, but the implications of Watson are far-reaching. From then on, Watson went on to do some serious work around the world. You can read more about it here
Ken Jennings, in his final jeopardy question, wrote underneath his answer: “I for one welcome our new computer overloads.”
Source: New York Times
Other examples
While doing research for this article, I came across several fascinating examples of machine learning and artificial intelligence. In the interest of keeping this article short, I have not included them. If you’re interested in hearing more fascinating stories like these, please leave a comment at the end of this post. If there is enough interest, I will put them together in a separate post.
We are seeing a technological revolution, one that began at the turn of the century. In the past, though, technology replaced manual labor and work that involved a high degree of calculation. But recently we are seeing great progress made in domains which were previously thought to be exclusively human domain – thinking, learning, and strategizing. Increasingly this new computing paradigm seems to be encroaching and infringing upon our prized abilities. From the 19th century till the end of the 20th century we saw robotics replacing jobs that required manual labor. But the current trend is of replacing mid- and high-skilled workers. The computer that beat us at chess and trivia pave a path for the computers that will replace business strategists, scientists, doctors. Creativity will soon be replaced by algorithms for creativity.
There are social implications that we need to be concerned about, apart from the economic benefits of these. In the next post (the 3rd installment of this series), we will examine exactly these : the economic and social implications of the new wave of learning machines.
A few days ago SAP announced SAP Business Suite 4 SAP HANA. Shortened to SAP S/4HANA, this is a big strategic launch. Here is why you need to take heed.
The new SAP S/4HANA is supposed to replace the SAP Business Suite (formerly R/3) over the next few years. This announcement and the launch of the software lay a roadmap for SAP in the coming years.
What led to this launch?
SAP is a leader in ERP worldwide. However, in the recent past, a new trend is taking over in the business world. Cloud-based software services also known as Software-as-a-Service. SAP has SaaS components to it, but its main business model has been selling software the old way: software installed at the customers’ premise.
Other cloud companies such as Workday have been slowly chipping away at SAP’s market share. And now this is SAP’s answer.
Name
The R in R/3 stood for real-time. The S in the S/4 stands for Simple. This is the big idea. SAP is planning on simplifying the ERP system with this release.
Database
While SAP R/3 Business Suite ran on any database, S/4 runs exclusively on HANA. SAP has spent considerable financial resources and effort on building up the in-memory database over the past few years. SAP HANA has tremendous performance advantages compared to the older disk-based database solutions. This large-scale change has enabled SAP to dramatically simplify both the data-model as well as the user-experience.
One significant aspect of HANA is that it is an in-memory appliance. This means data-access times (disk read/writes) are not an issue anymore, allowing developers to focus more on business logic than performance. This lends itself to the other motivation for S/4 – simplicity.
The Cloud
SAP S/4HANA is mostly a movement of SAP’s premier software from customer premise to the cloud. However, on-premise solution will still be available. SAP offers 3 options:
Public Cloud – Completely managed by SAP. Multi-tenancy shared by all public cloud customers
Private Cloud – Partially managed by SAP. Exclusive database per customer.
On-Premise – Software installed on client’s hardware. Client pays for user-licenses.
Software
SAP S/4HANA will allow customization to S/4HANA on the HANA Cloud Platform (HCP). This means ABAP developers will get to continue to use their skills. If you don’t know OO, it is a good time to learn it.
UI
Let’s admit it, SAP R/3 has not been known for its stellar user-experience. UI on SAP R/3 has been clunky, rigid and unwelcoming. But the S/4HANA user-interface will be based on SAP’s Fiori UX platform. SAP Fiori, launched earlier in 2014, gives the software a new look-and-feel. The fact it does not have licensing cost should make it attractive to customers with an existing SAP installation.
As far as I can tell, it will be a big improvement.
Innovation
I really don’t have anything to say about innovation, but you cannot write a whole post on SAP and not mention the word Innovation. So, that’s that.
Conclusion
Co-founder, Hasso Plattner said “If this doesn’t work, we’re dead. Flat-out dead.” This may be just Hasso Plattner being the passionate visionary that he is. But this indeed is a huge launch from SAP, one whose initial roll out is expected to be 3-5 years, and customer transitions lasting more 10 years.
Let’s wait and see if this works or we will be flat-out dead. But as Keynes said “In the long run, we are all dead.”
The remaining installments will be published in the next few weeks. I will update this article with links to them.
Can you build a computer that can think for you, and may be run your business? Computers have been an integral part of any business enterprise for a long time now, insomuch that everything we do in business has computers’ finger prints all over. But the primary function of computers has been that of aiding the humans in their running of the business, not actually running it for us. But a brave new generation of computers is on its way that plan on turning this paradigm on its head.
Imagine computers that think, that understand how your business is run, recognize what works and what does not, correct issues as they go along, and most importantly, ones that do this with virtually no aid from you. These computers almost do not exist today, but will be business-as-usual someday. What does it entail to build such computers? How much of this is hype and how much reality? What are the classes of problems these computers are expected to solve? A branch of study in Artificial Intelligence (AI) called Machine Learning has been trying to answer these questions.
What is machine learning?
A typical computer program is a series of instructions executed on a set of data. The code is supposed to read the data, manipulate and transform it. Machine learning, on the other hand is not about transforming data, instead about recognizing patterns in the data, discovering deep insights in the structure of the data, all on its own. In fact, it is even more than that: It is about a computer that understands data and gets smarter and smarter.
Machine leaning is about creating algorithms that start with a blank slate, and builds up its knowledge as they process and analyze data. The bigger the data, the smarter they get. The do so in a variety of ways.
Take for instance, a hypothetical chess-playing learning machine. This machine first learns the basic rules of chess by watching people playing chess – rook moves horizontally and vertically, bishop moves diagonally, etc. Then the computer learns the goal of the game – to win. To extend this example further, the computer learns how to achieve the goal. It learns from the games strategies. While the computer is never coded to perform any specific list of chess plays, it is designed to learn them from the input data – studying previous games and reassessing the games it plays against its opponents.
Hypoethetically, one copy of this software is given amateur chess player, and another one to, say, Gary Kasparov (former world chess champion), and both are allowed to play solely against their masters. After a certain period of time, if these two copies are made to go head to head, the latter copy will trounce the former. This is because the latter learned from a superior dataset, one that was accumulated playing against Kasparov.
To Teach or not to Teach
Broadly speaking, there are two categories of learning algorithms: Supervised and Unsupervised. If the input data also known as training-set is clearly labeled – the computer knows what it is looking at – then it is supervised learning. However, if your data is a big clutter of bits, and the computer starts off without knowing what it is looking at, but it learns as it goes along, that would be unsupervised.
For example, a face-recognition learning system processes several images of faces and non-faces from a training-set that is clearly labeled – faces in each image are marked and labeled. During the learning process, the computer isolates the unique features of faces that are not to be found on non-faces. Subsequently, the computer is now equipped with the “knowledge” of how to distinguish between faces and non-faces. The more images of faces and non-faces it processes, the stronger its knowledge is.
On the other hand, in the construction of a computer that classifies human emotions. The training-set contains no labels for facial expressions and how they correspond to human emotions. The system is fed series of video snippets with human faces containing various emotions and their subsequent actions. Your computer is supposed to see the subtle changes in the facial expression and group them into various categories and associate them with the subtle difference in the subsequent actions of these actors.
Given that these two examples of very simple, there may be an overlap in their classification. But the essential idea is this: Supervised is when the computer clearly starts off knowing what it needs to do, and goes on to becoming really good at doing that. On the other hand, in unsupervised learning, the computer typically has no idea what it is looking at or what it’s supposed to find, and then goes on to discover hidden pattern and deep structures in data.
Although different functionalities dictate which learning is more suitable for the specific purposes, when it comes to the context of big data, unsupervised learning algorithms are expected to be heavily used in the near future. Unsupervised learning is well-suited in systems of data which contains deep hierarchical and/or causal relationships between observations and/or latent variables.
Learning algorithms may not clearly fall along this dichotomy. Most algorithms have a combination of the two. Within the same system, some aspects of learning may be supervised, while others may be unsupervised.
Business Intelligence vs. Learning Machines
There are some striking similarities between the data mining components of Business Intelligence suites that are used for pattern recognition, and the actual machine learning implementations. While BI data mining is a set of tools and techniques used by humans to aid in pattern recognition and eventually make better decisions, machine learning is performed primarily to the advantage of the machines themselves — in order to perform better by reorganizing itself. There is a significant overlap in the various techniques used in these two domains of data analysis.
So how does a computer learn?
Another way of classifying learning machines is the expected output. Let us see the kinds of output we expect from these computers.
Regression Analysis: The excepted output of this computer is to find hidden relationships between two or more variables. For e.g., is there any relationship between the weather outside and my sales data.
Classification: The expected output on this learning system is to take a large chunk of data and classify them according to preset categories. For e.g., what criteria can I use to categorize my employees as top performers, team players and laggers.
Cluster Analysis: Similar to classification, cluster analysis takes a series of similar objects and classifies them. The difference between this and the previous method is that clustering has not preset categories. Objects scatter over the data-space, and computer identifies clusters in them. For e.g., identifying customer clusters for targeted marketing
Computers can learn to run your business for you
While the science of machine learning has been flourishing in the scientific and mathematical circles, the business community has been slow to adopt the trends. With the exception of financial institutions and some sales and marketing campaigns, thinking and learning machines have not made much headway. With the ubiquity and popularity of big data infrastructure, such as Hadoop, it is easy to see that the near future hold exciting trends in machine learning in the business.
Big data enables businesses to adopt machine learning technologies. The potential for machine learning as a field of study and its business applications is unlimited. There are so many problems we know, but do not know how to solve. There is a bigger list of problems that we do not even know exists, let alone know how to solve them. If we ever hope to discover these problems and solve them effectively, learning machines are our fiends.
Big data Analytics is the new buzz in town. It is every big data analysts’ dream to analyze data, big or small, and get insights into things that were previously unseen by others. And now we have the tools — software and hardware — to analyze large amounts of data in a way that leads to meaningful and sometimes actionable analytics.
However, data is only as valuable as the analysis one performs on it, and Analytics is only as insightful as the person doing the analysis. The main function of a Data Analyst is to derive actionable analytics from the swath of data available. Sometimes, the same data can be analyzed by different analysts reaching different conclusions – quite possibly contradictory conclusions. There are many reasons that might lead to this contradiction. I thought it would be a good idea to list some cautions on any exercise of data analysis, big or small.
Even a broken clock is right twice a day
As stated earlier, the analytics derived from data is only as insightful as the analyst performing it. As an analyst looking for patterns in data, you will encounter several apparent hits. While it is exhilarating to see patterns emerge from data analysis, it is just as important to look further to see if the emergent pattern is indeed a real-world pattern or just a statistical anomaly.
More often than not, emergent patterns are just that — patterns that appear in small segments of a larger data set. If patterns appear sporadically or sparsely, it is most likely a false positive. Large data sets inherently contain statistical anomalies. In fact, the bigger the data, the higher the probability that improbable (and consequently inaccurate) patterns are hidden in smaller subsets of the larger dataset.
Even a broken clock is right twice a day, and if you happen to check the time at those right times, you will wind up thinking that the clock was working.
Climate is not weather
I am always mildly amused by people who say things like “It’s so cold today; so much for global warming”. While I get that it is just a joke, the undertone in the statement clearly points to a lack of understanding in the difference between weather and climate, or more generally, perceiving apparent patterns in really random or unrelated events.
Science spokesperson and astrophysicist, Neil deGrasse Tyson drops some knowledge in this video below, a segment from his TV Show, Cosmos.
Courtesy: National Geographic
Keep your eye on the man, not the dog!
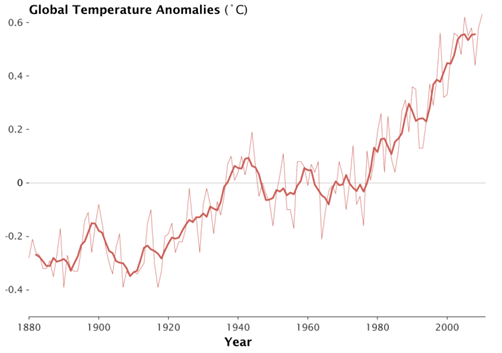
The point to take home is that, at smaller scales, the data might look either haphazard or manifest a specific pattern. However, applying a broader context may reveal another pattern, one that is quite different.
In the chart below (courtesy NASA Goddard Institute for Space Studies), the lighter line represents annual global temperatures, and the darker thicker line represent the 5 year running mean. If you focus on the thinner line, you will notice that patterns are haphazard. There are three years between 2000 and 2010 where the temperature is actually cooler than 1998. However, the thicker line which averages the 5 years around the data point shows a clear rise in temperature over the past couple of decades. Yet again, the thicker line also shows the temperatures flattening out in the last decade. It’s easy to see why one would just observe the last decade and claim the global temperatures have flattened. But upon closer inspection in a broader context, there have been similarly sized flattening happening in the 80s and 90s. The bigger picture from 1960 to 2010 is one of clear and undeniable growth.
Source: NASA Goddard Institute for Space Studies (http://www.giss.nasa.gov/)
Applying a broader context is an essential part of data analysis. Keep your eye on the man, not the dog!
Correlation does not imply causation
This phrase is very often used in statistics, almost to the point that it is common sense in the data analysis community. Despite that, it is often an overlooked occurrence.
A correlation between two variables, no matter how strong they appear, need not necessarily mean that one has a causal relationship with the other. In fact, it does not necessarily even mean that one has any relationship to the other.
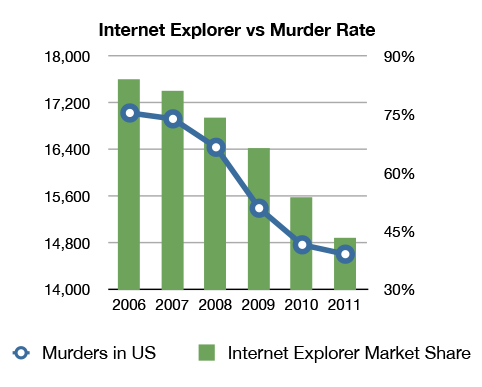
As shown in this comical chart below, there seems to be correlation between Internet Explorer usage and number of murders in the U.S. But it does not make any sense in the real world.
I am not sure if the data behind this chart is accurate, and I have no reason to believe one way or the other. However, I have no reason to believe that these two phenomena are even related, let alone one causes the other. Surely, it’s absurd to state that as people start using IE less they murder less, or the reverse, that as murder rates fall so does IE usage. However, the data seems to support these assertions.
While this example is patently absurd, there are many cases, where it might seem likely that there is a relationship. It is best to keep this catchphrase in the back of your minds: Correlation does not imply causation.
An extreme version of this catchphrase goes to the extent of saying that Causation can never be determined by analytical means, and should be left to the realm of philosophy. Correlation is good enough, as long as the corresponding hypothesis can be validated by its power of predictability. It essentially means that if a correlation is noted, and it is repeatable and predictable, then it is not required to prove the causality aspect of the correlation.
While it is important to understand that correlation does not imply causation, a strong correlation is sufficient to make effective business decisions. True causality is certainly a curiosity, but one that is quite unnecessary in the context of business intelligence.
A picture is worth a thousand numbers, or a couple of terabytes
While computers are very powerful number crunchers, we humans are far superior visual analyzers, at least as yet. Computers can analyze visual data, but they do so, by and large, by converting the graphical data into numerical equivalents.
We certainly should use the power of computational data analysis. At times though, there is nothing better than the good old staring-at-a-chart data analysis. This is not because of any inherent problem with computational methods. Instead, it is because of the simple fact that computers do what the data analyst asks it to do. The problem is when the data analyst does not know what to ask for.
Computational (statistical) tools like Standard Deviation and Linear Regression, while powerful in their own right, are not suitable to spot blips or spikes in otherwise smooth data, unless one knows to look for it. Plot it on a chart, and the human eye will catch it in a blink. Again, I am not arguing that looking at charts is the best way of looking for blips. If you know you’re looking for a blip, it is really easy to have the computer look for it for you. But, in case you didn’t know what irregularities exist in your data, it’s better to plot it on a chart, and let the human eye/brain look for them.
There are many tools that let you plot your data. Microsoft Excel is a good place to start.
Follow the data; don’t make the data follow you
Almost every exercise in data analysis starts with a hypothesis. Although it would be ideal to perform research with a blank slate and come to conclusions after the analysis, it is almost inevitable that you will start with a hypothesis. In fact, in statistical inference, one starts with a null hypothesis.
The problem is in setting up scientific experiments or performing data analysis with the intention of proving a hypothesis. This is where confirmation bias kicks in. The level of attachment you have to your hypothesis determines how many data points you observe that prove you’re right. This is reminiscent of an adage President Obama used during his 2008 Presidential campaign: “If all you have is a hammer, every problem looks like a nail.”
There is a saying in the scientific community, and I paraphrase: if you have a hypothesis and you want to know if it’s true or false, then do not set up your experiments to prove that it is true. Instead try to prove that it is false. And if you can’t, then it may be true.
Also, always remember: You can never prove that a non-trivial hypothesis is true. You can either prove that it is false or that it is not false.
I thought I would write few words on Object-oriented programming. Now you might ask me why I am spending my time talking about a technology that’s almost as old as computer programming itself — an idea that has an all-pervasive nature to it in the industry, there is no need to flog the dead horse one more time. Here’s the reason. I can’t tell you how many times I’ve talked to software developers and designers, who know the text-book description of OOP, but have a very limited insight into it.
When you talk to someone who dabbles with OOP, you hear polymorphism, method-overloading, dynamic-dispatch, public and private methods. But these are not what set OOP apart from its predecessors. I am in no way implying that these are not significant additions that came out of OOP. These concepts are just derivatives of the bigger idea of OOP.
Encapsulation is the primary idea behind OOP. Encapsulation simply means bundling of data and associated methods.
Let me explain: Before OOP, computer programming was a series of instructions written one below the other. This is like a two-way communication. You, the developer, is telling the computer what to do in a series of instruction. The idea goes back to the 8th century Arabic mathematician al-Khwarizmi (which is where we purportedly get the word algorithm). This is all good if you’re writing a program to determine the greated common divisor of two numbers. But over time computers have gone on to solve bigger problems, and procedural programming just doesn’t cut it.
So let’s say you’re writing a computer simulated solar system. In a purely procedural language set up, you would write a big program called “solar_system”, which controls all the planets and the sun, with a main function ‘run_solar_system()’. On the other hand, if you write a program, one that is influenced by object-oriented paradigm, it would contain encapsulations of the class of planets, with particular instates of each of the planets.
Compare the two very simplistic example codes of how each one of them looks:
Notice that in the first case, solar_system is doing the calculations for all the planets – a one way communication. In the second case, the communication is between the planet and the sun – direct communication. This code, if well written can be extended between any two (or three of four) objects within the solar system.
It is true that the expressive measure of both the paradigms is identical. What you can write in the OO paradigm could just as well be written in the procedural one. What makes the OO stand out, is its readability.
The line of code in the OO paradigm can be read as “Let Jupiter calculate its next position based on the gravitational field of the sun). Compare that to the lines of code in procedural paradigm would read something like this: “Take Jupiter’s current position, and take the gravitational field of the Sun, and using both, do some calculations and determine the next position Jupiter ought to take.”
By extension of it being readable, OO lends itself to thinking in terms of how we perceive the real world. And all this is achieved primarily by a single concept – encapsulation. By making a class called Planets, and instantiating Earth and Jupiter as Planets, the programmer has enabled the individual objects to communicate with each other, rather than letting an overarching program do all the dirty work. A clean readable code, implemented by a clean and organized underlying objects.