Tag Archives: business intelligence

The Human Aspect of Predictive Analytics

By Ashith Bolar , Director AmBr Labs, Amick Brown

The past decade and a half has seen a steady increase in Business Intelligence (BI). Every company boasts a solid portfolio of BI software and applications. The fundamental feature of BI is Data Analytics. Corporations that boasts large data do indeed derive a lot of value from their Data Analytics. A natural progression of Data Analytics is Predictive Analytics (PA).

Think of data analytics as a forensic exercise in measuring the past and the current state of the system. Predictive Analytics is the extension of this exercise: Instead of just analyzing the past and evaluating the current, predictive analytics applies that insight to determine, or rather shape the future.

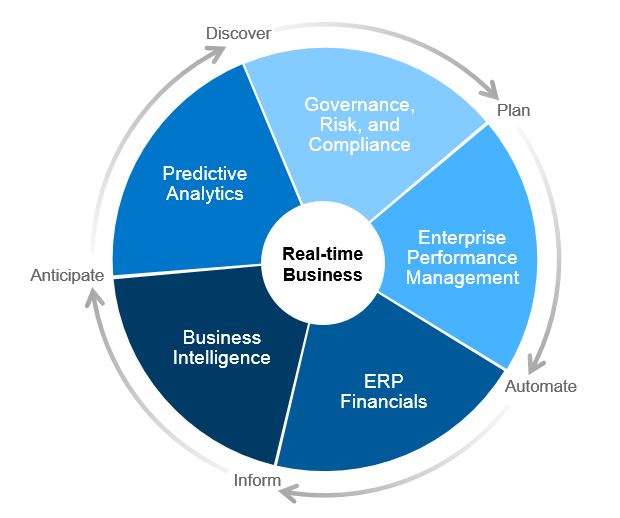
Predictive Analytics is the natural progression of BI.

The current state of PA in the general business world is, for the most part, at its inception. Experts in the field talk about PA as the panacea – as the be-all and end-all solution to all business problems. This is very reminiscent of the early stages of BI towards the turn of the century. Hype as it may be, BI did end up taking the center stage over the ensuing years. BI was not the solution to the business problems anymore; it was indeed mandatory for the very survival of a company. Companies don’t implement BI to be on the leading-edge of the industry anymore. They implement BI just to keep up. Without BI, most companies would not be competitive enough to survive the market forces.

Very soon, PA will be in a similar state. PA will not be the leading-edge paradigm to get a headstart over other companies. Instead PA is what you do to just survive. All technologies go through this phase transition – from leading-edge to must-have-to-survive. And PA is no different.

predict the future

Having made this prediction, let’s take a look at where PA stands. Some industries (and some organizations) have been using predictive analytics for several decades. One such not-so-obvious example is the financial industry. The ubiquity of FICO scores in our daily lives does not make it obvious, but they are predictive analytics at work. Your fico score predicts, with a certain degree of accuracy, the likelihood of you defaulting on a loan. A simple number, that may or may not be accurate in individual cases, arguably has been the fuel to the behemoth economic machinery of this country, saving trillions of dollars for the banking industry as well as the common people such as you and me.

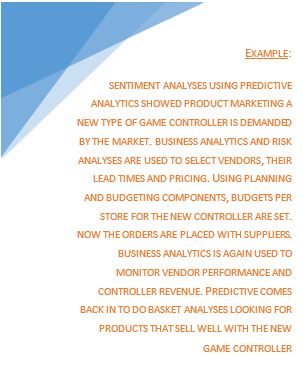
Another example would be that of the marketing departments of large retail stores. They have put formal PA to use for several years now, in a variety of applications such as product placement, etc. If it works for them, there is no reason it should not work for you.

This is easier said than done. Implementing Predictive Analytics is not a trivial task. It’s not like you buy a piece of software from the Internet, install it on a laptop, and boom – you’re predicting the future. Although I have to admit that that is a good starting point. Implementing the initial infrastructure for PA does require meticulous planning. It’s a time-consuming effort, but at this point in time, a worthy effort.

Let’s take a look at high-level task list for this project

  1. Build the PA infrastructure
  2. Choose/build predictive model(s)
  3. Provision Data
  4. Predict!
  5. Ensure there’s company-wide adoption of the new predictive model. Make PA a key part of the organization’s operational framework. Ensure that folks in the company trust the predictive model and not try to override it with their human intelligence.

Steps 1 thru 4 are the easy bits. It’s the 5th step that requires a significant effort.

Most of us have relied on our superior intellect when it comes to making serious decisions. And most of us believe that such decision-making process yields the best decisions. It is hard for us to imagine that a few numbers and a simple algorithm would yield better decisions than those from the depths of our intellect.

However, it is important to change your organization’s mindset about predictive analytics. If you are considering your business to be consistently run on mathematical predictive models, acceptance from the user community is crucial. Implementing PA is a substantial effort in Organizational Change Management.

Remember the financial services industry. They don’t let their loan officers make spot decisions on the loan-eligibility of their clients based on their appearance, style of speech or any such human sensory cues. Although, if you ask the loan officer, they might claim to be better judges of character – the financial industry does not rely on their superior human intellect to measure the risk of loan default. Generally, a single 3-digit number makes that decision for them.

The next time you go to the supermarket for a loaf of bread, and return with a shopping cart full of merchandise that you serendipitously found on the way back from the bread aisle including the merchandise along the cash-counter, you can thank (or curse) the predictive analytics employed by the store headquarters located probably a thousand miles away from you.

AmickBrown.comGet What You Expect

“Passionate on Analytics” , new book available

from Iver van de Zand

My book “Passionate On Analytics” is available now

Driven by a deep believe of the value of business analytics and business intelligence in the era of Digital Transformation, the book explains and comments with insights, best practices and strategic advices on how to apply analytics in the best possible way. 25 Years of analytics hands-on experience come together in one format that allows any analytics userHow proud can one be?

My first book titled “Passionate on Analytics” is now available from the Apple iBooks Store via this link.

Since I am evangelizing on interactive analytics every single day, I decided to create aninteractive ePub book. It contains over 60 best practice and tutorial videos, tons of valuable links and galleries and 33 extended articles providing insights on various analytics related topics.

Passionate on Analytics (206p) has 4 sections:

  1. Insights: 13 deep dive articles on various aspects of business analytics like industry specific approaches, embedded analytics and many more
  2. Strategy: 13 chapters talking analytics strategy related subjects and topics like defining your BI roadmap or the closed loop portfolio
  3. Best Practices: 10 expert sessions showing and demonstrating best practices in business analytics like using Hitherto charts, how to make a Pareto or visualization techniques
  4. Resources: a wealth (!) of resources on analytics

Please find below some screenshots.

I am very happy with the book with has brought up the best in me. Everything I learned, experienced or discussed during my 25 years tenure in business analytics, is expressed in this book. The book is fully interactive meaning you can tap pictures for background, swipe through galleries or start an tutorial video.

Special thanks goto Ty Miller, Timo Elliott, Patrick Vandeven and Waldemar Adams who I all admire a lot.

Iver


Artificial Intelligence meets Business Intelligence

By Ashith Bolar, Director of Research, Amick Brown

It’s bound to happen:  Artificial Intelligence (AI) will meet Business Intelligence (BI). In fact, in several places, it has already happened. But let’s take some time to see how this convergence is progressing, if at all.

The first decade of the 21st century was all about Business Intelligence. Towards the end of the decade, big strides were made to harness the explosion of Big Data. The second decade has been mostly about fuelling Business Intelligence with the Big Data. Several companies, large and small, have been making very impressive strides in this direction. However, there is still a lot of room for improvements.

On the other side in the world of computing, Artificial Intelligence has been making slow inroads in all aspects of life. In the last 15 years, AI has been creeping up into our personal lives with applications such as Siri, the entire Google ecosystem, and a myriad of social networking applications. All of this is happening without us realizing the amount of AI happening behind the scenes. Artificial Intelligence has moved out of the academic realm towards the daily lives of consumers.

Much of the business community associates AI with machine learning algorithms. While that’s true, it leaves much of AI underappreciated for its real capacity in Business Planning and Data Analytics. There is more to AI than just recommending your next movie on Netflix and making Google give you better results on your web search.

There are several applications and platforms that transform and summarize a corporation’s big data. However, ultimately it’s the humans that consume this summary of data, to make decisions based on higher human intelligence. I argue that this will change over the next decade. If history is any indication of how accurate our predictions of coming technological revolutions are, I would imagine this transformation will happen much sooner than a decade.

Most of us know Big Data and the Internet of Things that has enabled this explosion. Big Data infrastructure does much of the heavy lifting of cleaning up, harmonizing, and summarizing this data. However, the actual process of deriving intelligence and insights is still within the human realm.

Inevitably, the future of Business Intelligence goes hand in hand with Artificial Intelligence.

The new wave of BI software should be able to perform the basics of building data analytics models without human intervention. These systems should be able to generate hundreds of models overnight. The next step is to build systems that not only generate redundant set of models, but also identify the good models – ones that model reality accurately – and weed out the bad models. The third wave of solutions will be the ones that make a majority of decision making for a company.

In the coming posts, we will explore in more details some of the initial attempts of converging Artificial Intelligence and Business Intelligence.

The Closed Loop portfolio in Analytics

The Closed Loop portfolio in Analytics

Authored by Iver van de Zand, SAP

We talked about the overwhelming power of analytics in Retail and B2C market-segments earlier and one of the topics discussed there, was the integration of operational business activities with operational analytics. In the example we saw the stock manager using analytics to change his stock-buying-behavior. He adjusted his order system by choosing another vendor and placing the order. Immediately his analytics are updated and he now requires to adjust his rolling planning or run a predictive simulation how the price-adjustment of his new stock might affect buying behavior of his customers. He might even want to adjust the governance rules with his new supplier or run a risk-assessment.


Below pictures visualizes the continuous integration of core business activities with business analytics, indicating examples of core processes with their accompanying analytical perspectives. These are just examples and not exhaustive at all.


Performance Management closed loop

Basically what the stock manager in our example needs, is a full – real-time – integration of business analytics with his core business activities over all aspects of his performance management domain. A predictive simulation of changing buying behavior lead to new analytical insights on product mix which might influence the companies’ budget and causes a risk analysis for new vendors.

To do so, a closed loop is required of following core components driven by the continuous flow of Discover – Plan – Inform – Anticipate:

  • online Analytics on big data with interactive user involvement
  • ability to adjust and monitor a rolling Planning for budgets, forecasts. A planning that that allows for delegation and distribution from corporate level into lower levels
  • GRC software to perform risk analyses on for example vendors or suppliers
  • online Predictive analyses components to apply predictive models like decision trees, forecasting models or other R algorithms. Predictive analyses allow to look for patterns in the data that “regular” analytics is not able to discover. The scope of predictive analytics is gigantic: think not only sentiment analyses for social media, but also basket analyses in retail markets, attrition rates in HR and many, many more.


This so-called closed loop of predictive analytics, planning and performance management, business analytics and GRC is NOT a sequential process at all. They interact randomly towards each other in real-time and at any moment needed. They are also dependent towards each other, since Digital Transformation requires us to be so agile, we have to constantly execute and collaborate on the interoperability of the components and monitor the outcome. Lastly, the closed loop platform interacts on core operational activities (real-time insights in operational data) and as such the analytics are defined as Operational Analytics.

Closed loop platforms more than anything else require business users to drive its content and purpose. They drive the agility to the platform that is so heavily needed in the Digital Transformation era. On the other hand the technical driven architects do make a difference too, since closed loop platforms are very sensitive to respect governance principles. A special role is allocated to the CFO or Office of Finance here; they will drive the bigger part of the Planning and Budgeting cycle.

One can imagine the calculation processes behind the closed loop platform are huge and therefor a business case for an in-memory system is a sine qua non.

Imagine the possibilities

Needless to say that the closed loop model applies to all industries and not only in the retail example that I used here. I can list plenty of examples here but just to name a few:


  • HR: attrition rates of employees
  • Banking & Insurance: customer segmentation, product basket analyses
  • Telco & Communications: churn and market segmentation nut also network utilization
  • Public Government: Fraud detection and  Risk-Mitigation
  • Hospital: personalized healthcare

Apart from imagining the possibilities per market segment, we can also change perspectives and look at the possibilities per role within companies applying the closed loop platform. Below picture provides capabilities the closed loop components could offer to various user communities. The potential is huge and extremely powerful when used in an integrated platform. This is also the weaker point of the closed loop platform: the components must be integrated not to miss their leveraging effect on each other.

A solution is available today

With its Cloud for Analytics offering, SAP is today the only provider with an integrated offering for the closed loop platform. Even more: SAP Cloud for Analytics is integrated in one tool offering analytics, planning, GRC and predictive capabilities. One tool?? …. Yes, one tool completely Cloud driven and utilizing the in-memory HANA Cloud Platform it is running on. One tool that seamlessly lets analytics and planning interact with each other. A tool where you can run your predictive models and analyses and visualize the outcome with the analytics section. A tool that allows access to both your on premise data, your Cloud data and/or Hadoop stored data. And lastly a tool with fully embedded collaboration techniques to share your insights with colleagues but also involve them with planning or others.  Our dream becomes reality.


Data Driven Decisions improve your business

Fact Based Decision Making

For many companies the first reporting and analytics question that they ask is, “What specific items should my company measure?” However, what you measure should be based on how to get results from your data that make measurable change in the organization. The first question really is, “What are my business goals and what measurable components can help me achieve or miss this goal?

Decision Man

Some examples are:

  1. Churn reduction
  2. Retirement possibilities in the next year.
  3. Employees that leave in less than a year
  4. Departments with the highest attrition
  5. Supply chain service improvement
  6. JIT miscalculations by department or location
  7. Customer service complaints, late deliveries to customers
  8. Staffing variations and what affect this has on production 

Why fact based is important…

Another huge common occurrence in the reporting world is decisions made without trackable, measureable fact. Unbelievably, companies still make decisions with historical process, experience, and their “gut” to some degree.

With the availability of big data, your competitors are not only going to have access to information about themselves, but also about your customers and your ability to perform. If this data is not used well by your company – you will lose business.

So how exactly does your company aggregate data, produce reports, or glean insight to meet goals? If you are like the vast majority of companies out there, it is a big data dump into a spreadsheet that is picked through and interpreted by the individual who requested it.

Many have very slick Reporting solutions, but they are not leveraging them to the full potential – not by a long shot. Why is this? The pervasive gaps are that people are creatures of habit and continue to want to report like they have always done and change management/training is not factored in. The poor IT Manager put in charge of the BI project is inundated with data dump requests and help requests on-going.

Circling back to Data Driven Decisions, the very first things that must be carefully and completely determined are:

  1. What are the challenges that prevent me/my company from beating the competition, increasing revenue, operating smoothly, etc?
  2. What people drive the resolution of these challenges?
  3. What data and report metrics do these users need to show the golden road to overcoming the challenges?

Beginning with what decisions need to be made, which people will drive goal attainment, then what data and metrics will roll up to an answer – the first big hurdle to Business Intelligence success will have been overcome.

For more on this subject, watch this space… blogs.amickbrown.com/ 


Top Three Hurdles to Successful Reporting and Analytics

This is a first conversation based on what I am hearing in the market. There will be more to come, and I want your thoughts please. Let’s make a difference. 

Top Three Hurdles to Successful Reporting and Analytics

The challenge of useful, powerful, and appreciated Business Intelligence is felt across industries, departments, and roles. By using BI well, you will position yourself to beat your competition. If you do not use the data available to drive business decisions and goal attainment, you position your competitors to win – because they ARE leveraging their data.

What is the definition of successful Business Intelligence?

My best practices definition is “Success is measured by the ability of the right people, to use the right data, and create usable reports that aid in business goal attainment”.

Sounds simple, right? Well it will be with planning, understanding and buy-in from users at all levels. It is truly a change management issue as well as a technology issue. IT will drive the technology side, but must work hand in hand with the various business leaders to develop outcomes that make a difference in efficiency, process, and profitability.

The Top 3 Hurdles to BI Success:

  1. “Give me all of the data and I will figure out what I need”

Users, Managers, and Executives do not realize the depth of business case resolution that their data can provide. The approach tends to be, “give me all of the data and I will figure out what I need and want to use.” Inherently, this is manufacturing the outcome instead of letting it manifest organically.

Tied closely to this request is the real situation that people do not like change. They “have always done it this way” is a first cousin to the data dump method. Overcoming a historic process can be harder than learning how to use BI well.

With the powerful BI tools available, dashboards and reports can be targeted to achieve business success. These successes will be defined by each leader based on corporate goals. The tough part comes in taking a measurable goal and allowing the solution to mine the data from various sources to provide accurate reports from which to make decisions. Long story short – is the report authentic and actionable.

  1. “My data is a mess ! “

How many times have I heard that reporting and analytics is a moot point because the data flowing in has not been cleansed or integrated in years. Well then, we know where to start because this statement is true. Garbage in is garbage out.

So, this hurdle to BI success becomes part of the solution. Regardless of how simple the reporting and analytics outputs are, their foundation must be in valid data.

Housekeeping is essential – so the longer cleaning the house is put off, the dirtier it will get.

  1. One and done is not an option

Let’s look at a very common situation: When the shiny new “box” of BI software came – the enthusiasm was real. Users throughout the company were vested and interested in the cool reports that they would be able to generate. Well, that was 8 years ago. Hopefully much has changed in your business since then. The reports, however, have not changed. You are measuring and dwelling on 8 year old business challenges. This is definitely not effective.

A proactive sustainability plan will separate the average performing BI users from the rock stars. Incorporate this into your reporting and analytics plan!

YES – THIS IS PURPOSELY REPEATED – IT’S IMPORTANT

This is a first conversation based on what I am hearing in the market. There will be more to come, and I want your thoughts please.

 The challenge of useful, powerful, and appreciated Business Intelligence is felt across industries, departments, and roles. By using BI well, you will position yourself to beat your competition. If you do not use the data available to drive business decisions and goal attainment, you position your competitors to win – because they ARE leveraging Big Data.