Tag Archives: ivervandezand

“Passionate on Analytics” , new book available

from Iver van de Zand

My book “Passionate On Analytics” is available now

Driven by a deep believe of the value of business analytics and business intelligence in the era of Digital Transformation, the book explains and comments with insights, best practices and strategic advices on how to apply analytics in the best possible way. 25 Years of analytics hands-on experience come together in one format that allows any analytics userHow proud can one be?

My first book titled “Passionate on Analytics” is now available from the Apple iBooks Store via this link.

Since I am evangelizing on interactive analytics every single day, I decided to create aninteractive ePub book. It contains over 60 best practice and tutorial videos, tons of valuable links and galleries and 33 extended articles providing insights on various analytics related topics.

Passionate on Analytics (206p) has 4 sections:

  1. Insights: 13 deep dive articles on various aspects of business analytics like industry specific approaches, embedded analytics and many more
  2. Strategy: 13 chapters talking analytics strategy related subjects and topics like defining your BI roadmap or the closed loop portfolio
  3. Best Practices: 10 expert sessions showing and demonstrating best practices in business analytics like using Hitherto charts, how to make a Pareto or visualization techniques
  4. Resources: a wealth (!) of resources on analytics

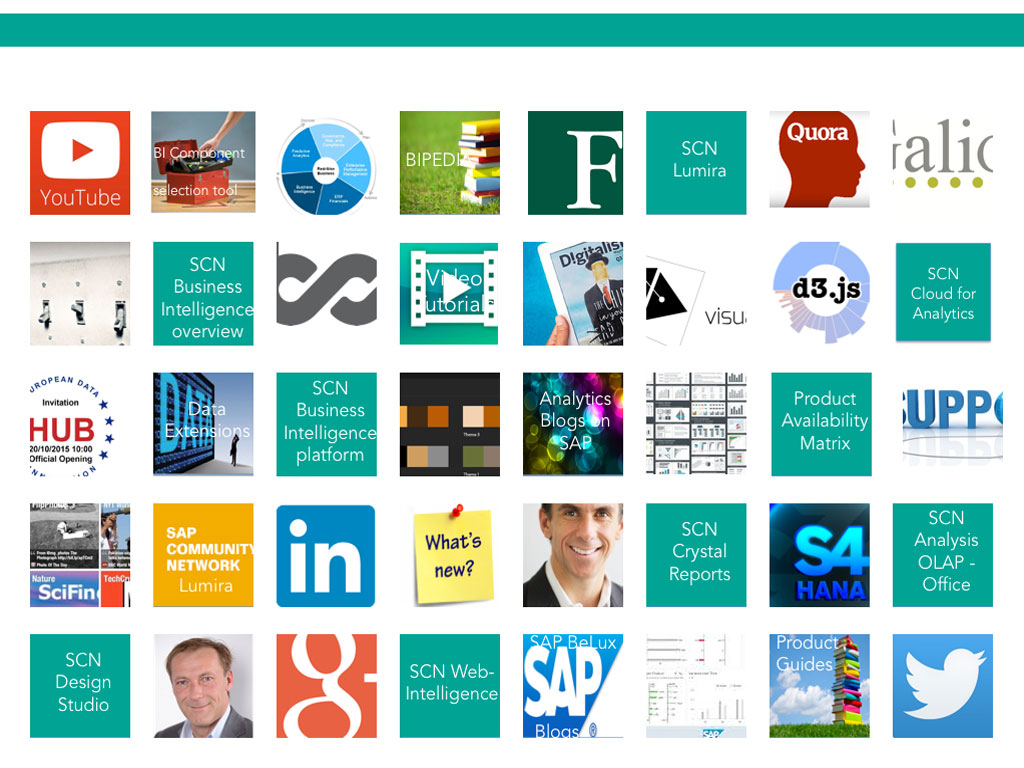
Please find below some screenshots.

I am very happy with the book with has brought up the best in me. Everything I learned, experienced or discussed during my 25 years tenure in business analytics, is expressed in this book. The book is fully interactive meaning you can tap pictures for background, swipe through galleries or start an tutorial video.

Special thanks goto Ty Miller, Timo Elliott, Patrick Vandeven and Waldemar Adams who I all admire a lot.

Iver


2016 and Business Analytics: Be Prepared for a Smashing Year: Part One

by Iver van de Zand, SAP

The end of the year is always a time to reflect, but also a time to look ahead and think about what might be different or innovating next year.three-spheres

Reflecting on 2015, three things immediately come to mind:

  1. Interactive self-service business intelligence (BI) has definitely landed and earned its permanent place. Every top-100 customer I talked to has self-service business intelligence in its BI strategy plans.
  2. “Traditional” business analytics (as in managed reporting and dash boarding) is not sufficient anymore for full performance management. A closed loop portfolio of analytical, predictive, planning, and GRC information is becoming a necessity in today’s management of processes and business flows.
  3. The value of in-memory platforms is now being recognized by leading companies. They massively adopt in-memory platforms to not only run their core applications, but also to integrate business data and facilitate analytics.

Looking forward, I’m sure you’ll agree with me that analytics is heavily influenced by the readiness of organizations to adapt to change resulting from the Digital Transformation. Connected economies and networks, data that’s available at any moment at any level, and sensor techniques allowing for new business models—they all heavily influence our needs for insights. As such, they heavily influence the 2016 trends for business analytics.

Did Tableau Lose Its Head?

Recently, I did the Google search exercise for “BI Trends 2016″and was both shocked and amazed. Our friends from Tableau’s marketing department have succeeded in monopolizing  80% of the first 20 hits! However, if you read closely, you’ll notice they are all referring to the exact same article. (Though they all seem to be different articles, they all cover identical things.)

I was further shocked  by the lack of insights these identical articles cover.  My feeling is that the articles point out  BI trends for 2014 (or earlier). “Governance and self-service become best friends,” it says. Dear people from Tableau, self-service BI can only exist by the sake of data governance. If self-service BI is not governed properly, there is no sense for it. And the trend mentioned as “Data Integration gets Exciting”? This was something everybody focused upon in 2012.

Analytical Projections for 2016

So what can we expect for 2016? Personally, I can only reflect on what I see and hear when talking analytics with key customers every single day. For me, these discussions have provided food for thought. Listening to the plans that my customers have, I can extract five key trends for business analytics in 2016:

  1. Self-service BI will become a commodity
  2. Business will embrace the portfolio loop
  3. Companies will really analyze Big Data
  4. Cloud BI adoption will accelerate
  5. Operational BI footprint will grow

Let’s take a closer look at the first two trends in today’s blog.

  1. Self-Service BI Becomes Commodity

Governed self-service BI will further find its way to all echelons of organizations. And the reason is simple— business users finally have the opportunity to drive analytics in their organizations. While 2015 was the year of adopting self-service BI, 2016 will be the year of the massive roll-out. Self-service BI is becoming a commodity in 2016 with the number of business users growing rapidly. From a functional perspective, the success of self-service BI is greatly determined by its ability to:

●  Interact with the user. Self-service BI can be adopted quickly because end users are able to interact with massive amounts of structured and unstructured sources of information.

●  Make data and insights easily visible. Business users really recognize the value of making insights visible. The simple but clever idea of using visualizations and analyses to create your own stories (storytelling and infographics) is very successful. Nice examples are GEO-driven stories, dashboards , and D3 open- source visualizations. These, combined  with interactivity, make self-service BI a stunning combo. As I’ve mentioned before,  “our meetings will never be the same.” We can now use interactive, visualized insights to discuss and monitor the heartbeat of our company in real time!

●  Be agile with new and ever-changing data. A third success factor (what’s in a name J) to self-service BI is its agility. This agility is a huge value-add because it allows business users to really simply acquire and enrich new data and use it for analyses. Bear in mind, this also applies to Big Data using in-memory computing.

  1. Business Embraces the Portfolio LoopReal-time business wheel

I’ve made my point on the importance of the closed loop portfolio in earlier blogs. Every key customer I met last year who’s willing to embrace Digital Transformation is seeking an integrated and governed platform to analyze, plan, predict, and assess risks in a constant and permanent loop.

I use the word ‘integrated’ on purpose here, since here is where the difference is made—customers seek to have real-time integration between their business analytics, their detailed planning, and the predictive models that affect, for example, product mix or pricing strategy. The integration also needs to be on operational financials and towards risks and compliancy cases when needed.

Many of my customers have accomplished this on a near-integrated level that isn’t real time by using individual components that access each other’s data. Products like SAP Cloud for Analytics are revolutionary here since they provide the closed loop portfolio covering real-time, interactive integration on all mentioned areas. Markets have been waiting for this for quite some time and are eager to adopt. It allows them to interact with market fluctuations that speed up due to the Digital Transformation. You can look at the examples I described in a previous blog for the retailing sector to understand the scope of the closed loop portfolio.

Stay tuned for my next blog. I’ll discuss the other three trends I see for business analytics in 2016: analyzing Big Data, the acceleration of cloud BI, and  the growth of operational BI.

Follow me on Twitter @IverVandeZand.

Amick Brown is here for you.


The Closed Loop portfolio in Analytics

The Closed Loop portfolio in Analytics

Authored by Iver van de Zand, SAP

We talked about the overwhelming power of analytics in Retail and B2C market-segments earlier and one of the topics discussed there, was the integration of operational business activities with operational analytics. In the example we saw the stock manager using analytics to change his stock-buying-behavior. He adjusted his order system by choosing another vendor and placing the order. Immediately his analytics are updated and he now requires to adjust his rolling planning or run a predictive simulation how the price-adjustment of his new stock might affect buying behavior of his customers. He might even want to adjust the governance rules with his new supplier or run a risk-assessment.


Below pictures visualizes the continuous integration of core business activities with business analytics, indicating examples of core processes with their accompanying analytical perspectives. These are just examples and not exhaustive at all.


Performance Management closed loop

Basically what the stock manager in our example needs, is a full – real-time – integration of business analytics with his core business activities over all aspects of his performance management domain. A predictive simulation of changing buying behavior lead to new analytical insights on product mix which might influence the companies’ budget and causes a risk analysis for new vendors.

To do so, a closed loop is required of following core components driven by the continuous flow of Discover – Plan – Inform – Anticipate:

  • online Analytics on big data with interactive user involvement
  • ability to adjust and monitor a rolling Planning for budgets, forecasts. A planning that that allows for delegation and distribution from corporate level into lower levels
  • GRC software to perform risk analyses on for example vendors or suppliers
  • online Predictive analyses components to apply predictive models like decision trees, forecasting models or other R algorithms. Predictive analyses allow to look for patterns in the data that “regular” analytics is not able to discover. The scope of predictive analytics is gigantic: think not only sentiment analyses for social media, but also basket analyses in retail markets, attrition rates in HR and many, many more.


This so-called closed loop of predictive analytics, planning and performance management, business analytics and GRC is NOT a sequential process at all. They interact randomly towards each other in real-time and at any moment needed. They are also dependent towards each other, since Digital Transformation requires us to be so agile, we have to constantly execute and collaborate on the interoperability of the components and monitor the outcome. Lastly, the closed loop platform interacts on core operational activities (real-time insights in operational data) and as such the analytics are defined as Operational Analytics.

Closed loop platforms more than anything else require business users to drive its content and purpose. They drive the agility to the platform that is so heavily needed in the Digital Transformation era. On the other hand the technical driven architects do make a difference too, since closed loop platforms are very sensitive to respect governance principles. A special role is allocated to the CFO or Office of Finance here; they will drive the bigger part of the Planning and Budgeting cycle.

One can imagine the calculation processes behind the closed loop platform are huge and therefor a business case for an in-memory system is a sine qua non.

Imagine the possibilities

Needless to say that the closed loop model applies to all industries and not only in the retail example that I used here. I can list plenty of examples here but just to name a few:


  • HR: attrition rates of employees
  • Banking & Insurance: customer segmentation, product basket analyses
  • Telco & Communications: churn and market segmentation nut also network utilization
  • Public Government: Fraud detection and  Risk-Mitigation
  • Hospital: personalized healthcare

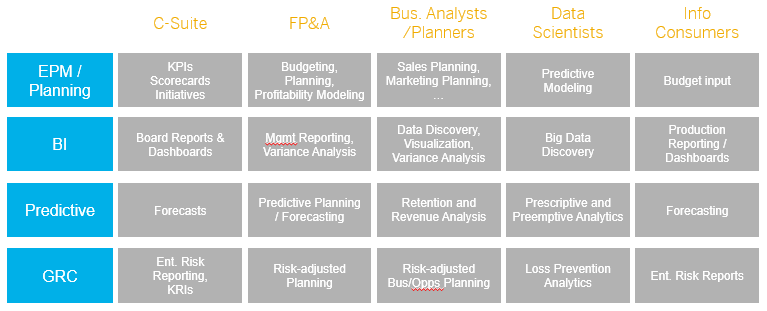
Apart from imagining the possibilities per market segment, we can also change perspectives and look at the possibilities per role within companies applying the closed loop platform. Below picture provides capabilities the closed loop components could offer to various user communities. The potential is huge and extremely powerful when used in an integrated platform. This is also the weaker point of the closed loop platform: the components must be integrated not to miss their leveraging effect on each other.

A solution is available today

With its Cloud for Analytics offering, SAP is today the only provider with an integrated offering for the closed loop platform. Even more: SAP Cloud for Analytics is integrated in one tool offering analytics, planning, GRC and predictive capabilities. One tool?? …. Yes, one tool completely Cloud driven and utilizing the in-memory HANA Cloud Platform it is running on. One tool that seamlessly lets analytics and planning interact with each other. A tool where you can run your predictive models and analyses and visualize the outcome with the analytics section. A tool that allows access to both your on premise data, your Cloud data and/or Hadoop stored data. And lastly a tool with fully embedded collaboration techniques to share your insights with colleagues but also involve them with planning or others.  Our dream becomes reality.