Tag Archives: predictive analytics

Get More Value From Operational Assets with Predictive Analytics

Kaan_groupSharpening operational focus and squeezing more efficiencies out of production assets—these are just two objectives that have COOs and operations managers turning to new technologies. One of the best of these technologies is predictive analytics. Predictive analytics isn’t new, but a growing number of companies are using it in predictive maintenance, quality control, demand forecasting, and other manufacturing functions to deliver efficiencies and make improvements in real time. So what is it?

Predictive analytics is a blend of mathematics and technology learning from experience (the data companies are already collecting) to predict a future behavior or outcome within an acceptable level of reliability.

Predictive analytics can play a substantial role in redefining your operations. Today, let’s explore three additional cases of predictive analytics in action:

  • Predictive maintenance
  • Smart grids
  • Manufacturing

Predictive Maintenance

Predictive maintenance assesses equipment condition on a continuous basis and determines if and when maintenance should be performed. Instead of relying on routine or time-based scheduling, like having your oil changed every 3,000 miles, it promises to save money by calling for maintenance only when needed or to avoid imminent equipment failure.

While equipment is in use, sensors measure vibrations, temperature, high-frequency sound, air pressure, and more. In the case of predictive maintenance, predictive models allow you to make sense of the streaming data and score it on the likelihood of failure occurring. Coupled with in-memory technologies, it can detect machine failures hours in advance of it occurring and avoid unplanned downtime by scheduling maintenance sooner than planned.

This all means less downtime, decreased time to resolution, and optimal longevity and performance for equipment operators. For manufacturers, predictive maintenance can streamline inventory of spare parts and the ongoing monitoring services can become a source of new revenue. And as predictive maintenance becomes part of the equipment, it also has the potential to become a competitive advantage.

Smart Grids

Sensors and predictive analytics are also changing the way utilities manage highly distributed assets like electrical grids. From reliance on unconventional energy sources like solar and wind to the introduction of electric cars, the energy landscape is evolving. One of the biggest challenges facing energy companies today is keeping up with these rapid changes.

Smart grids emerge when sensor data is combined with other data sources such as temperature, humidity, and consumption forecasts at the meter level to predict demand and load. For example, combined with powerful in-memory technologies, predictive analytics can be used by electricity providers to improve load forecasting. That leads to frequent, less expensive adjustments that optimize the grid and maintain delivery of consistent and dependable power.

As more houses are equipped with smart meters, data scientists using predictive analytics can build advanced models and apply forecasting to groups of customers with similar load profiles. They can also present those customers with some ideas to reduce their energy bill.

Manufacturing

The manufacturing industry continues its relentless drive for customization and “Lot sizes of 1” with innovations such as the connected factory, the Internet of Things, next shoring, and 3D printing. It’s also hard at work making sure it extracts the maximum productivity from existing facilities, which traditionally has been accomplished by using automation and IT resources. According to Aberdeen, the need to reduce the cost of manufacturing operations is now the top reason companies seek more insight from data.

Quality control has always been an area where statistical methods have played a key role in whether to accept or reject a lot. Now manufacturers are expanding predictive analytics to the testing phase as well. For example, tests on components like high-end car engines can be stopped long before the end of the actual procedure thanks to predictive analytics. By analyzing test data from the component’s ongoing testing against the data from other engines, engineers can identify potential issues faster. That in turn, maximizes the capacity available for testing and reduces unproductive time. That is only one of the many applications manufacturers find for predictive analytics.

Innovations on the Shop Floor

Predictive analytics provides an excellent opportunity for COOs and operations managers to extract additional value from production assets. It can also be an opportunity to create critical differentiators in the way products are created and delivered to customers—by providing it as a paid service (predictive maintenance) or as insight (predicting future electricity consumption).

However a company chooses to use it, predictive analytics can be the key to beating the competition.

Discover and Follow

And join the predictive conversation by following me on Twitter @pileroux.

AmickBrown.com


In the New Digital Economy, Everything Can Be Digitized and Tracked : Now What?

Woman Buying ClothesWelcome to a world where digital reigns supreme. Remember when the Internet was more of a ‘push’ network? Today, it underpins how most people and businesses conduct transactions – providing peer-to-peer connections where every single interaction can be tracked.

Enterprises are still not taking full advantage. With hundreds of millions of people connected, it’s possible for them to connect their suppliers with their customers and their payment systems, and reach the holy grail of seamlessly engaging in commerce, where a transaction can be tracked from purchase, to order received, to manufacturing, through to shipment— all in real time. It’s clear that end-to-end digitization delivers enormous potential, but it has yet to be fully tapped by most companies.

In the latest #askSAP Analytics Innovations Community Webcast, Reimagine Predictive Analytics for the Digital Enterprise, attendees were given an introduction to SAP BusinessObjects Predictive Analytics, along with some key use cases. The presentation covered native in-memory predictive analytics, deploying predictive analytics on Big Data, and how to bring predictive insight to Business Intelligence (BI).

The live, interactive call was moderated by  SAP Mentor  Greg Myers and featured expert speakers Ashish Morzaria, Global GTM Director, Advanced Analytics, and Richard Mooney, Lead Product Manager for Advanced Analytics.

The speakers noted that companies used to become leaders in their industries by establishing an unbeatable brand or by having a supply chain that was more efficient than anyone else’s. While this is still relevant in the digital economy, companies now have to think about how they can turn this new digital economy to their advantage. One of the keys is turning the digital economy’s key driver —the data— to their advantage.

Companies embracing digital transformation are outperforming those who aren’t. With predictive analytics, these companies can use historical data to predict behaviors or outcomes, answer “what-if” questions, and ensure employees have what they need to make optimized decisions. They can fully leverage customer relationships with better insight, and make meaningful sense of Big Data.

One big question delved into during the call: How can companies personalize each interaction across all channels and turn each one into an advantage? The answer: By getting a complete digital picture of their customers and applying predictive analytics to sharpen their marketing focus, optimize their spend, redefine key marketing activities, and offer product recommendations tailored to customers across different channels.

Real-World Customer Stories

The call also focused on some real-world examples of customers achieving value by using and embedding predictive analytics in their decisions and operations, including Cox Cable, Monext, M-Bank, and Mobilink.

These companies have been able to improve performance across thousands of processes and decisions, and also create new products, services, and business models. They’ve squeezed more efficiencies and margins from their production assets, processes, networks, and people.

One key takeaway is the importance of using algorithms, as they provide insights that can make a business process more profitable or competitive, and spotlight new ways of doing business and new opportunities for growth.

The speakers also presented a very detailed customer case study on Harris Logic. The company is using SAP BusinessObjects Predictive Analytics for automated analytics and rapid prototyping of their models. They execute models into SAP HANA for real-time predictions using a native, logistical regression model. This approach is allowing for the identification of key predictors that more heavily influence a behavioral health outcome.

Learn More

Lots of food for thought. See what questions people were asking during the webcast and get all of the answers here. Check out the complete presentation, and continue to post your questions and watch for dates for our upcoming webcast in the series via Twitter using #askSAP.

AmickBrown.com

What You Need to Know About Supply Chain Risk

#3 in  series by Matthew Liotine, Ph.D. , Strategic Advisor, Business Intelligence and Operations, Professor University of Illinois

In our previous articles, we discussed how disruptions to a supply chain can originate from a multitude of sources. According to some current trends, it is apparent that there is continued rise in measured losses from disruptions such as natural events and business volatility. Traditionally, supply chains are designed for lean operational efficiency wherever possible, yet such efficiency requires the minimization of excess capacity, inventory and redundancy – the very things that are needed to create resiliency against disruptive risks. Risk assessment tools and methodologies help decision-makers to identify the most cost effective controls that can strike the right balance between cost and risk reduction to protect against disruption. Typically, the most cost effective controls are those that can minimize the common effects arising from multiple disruptive threats. In order to understand the kind of controls that could be effective, one must recognize the risk outcomes from common supply chain vulnerabilities, which is the focus of this article.

What is Risk?

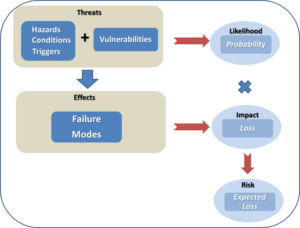
Before continuing, it would be worthwhile to revisit some of the terminology that we have been using in previous discussion, in order to understand how risk is derived. Fundamentally, risk is the chance (or the probability) of a loss or unwanted negative consequence. For decision purposes, it is often calculated numerically as a function of probability and impact (sometimes called single loss expectancy), and quantitatively expressed as an “expected” loss in monetary value or some other units. A common flaw with using risk values is that they mask the effects of impact versus probability. For example, an expected loss of $100 does not reflect whether high impact is overwhelming low probability, or high probability is overwhelming low impact. Thus, it is not clear whether this value is the expected loss due to an event that occurs 10% of the time and causes $1000 in damages when it occurs, or due to an event that occurs 20% of the time and causes $500 in damages when it occurs. For this very reason, risk values must be used in conjunction with probability and damage values, along with many other metrics, in order for the decision maker to compare the one risk against another. Risk values are not precise and are usually not to be used as standardized values for business management. Nevertheless, risk values can be used to provide decision makers with a means to distinguish risks and control options on a relative basis. Figure 1 illustrates the fundamental parameters that are used to construct risk values, and how they relate to each other.

SC 3 graphic

Figure 1 – Fundamental Components of Risk

Hazards, conditions and triggers are situations that increase or cause the likelihood of an adverse event (sometimes referred to as a peril). In our last article, we examined numerous sources of hazards that can threaten a supply chain. Vulnerabilities are factors that can make a system, in our case a supply chain, susceptible to hazards.  They are usually weaknesses that can be compromised by a hazardous condition, resulting in a threat. The likelihood, or probability, of a threat circumstance occurring must be considered, for reasons discussed above. If it occurs, failures can take place, whose effects are quantified as impacts. When impacts are weighed against the likelihood of the threat, the result is a risk that poses an expected loss. Controls are countermeasures that a firm can use to offset expected losses.

With respect to a supply chain, there are many ways to classify risk. Academics have made many attempts to try to classify risks according to some kind of ontology or framework (Harland, Brenchley and Walker 2003) (Gupta, Kumar Sahu and Khandelwal 2014) (Tummala and Schoenherr 2011) (Peck 2005) (Monroe, Teets and Martin 2012) (Chopra and Sodhi 2004). Some of the more common supply chain risk classifications include:

Recurring risks – These risks arise within the operational environment due to the inability to match supply and demand on a routine basis. The ensuing effects are lower service levels and fill rates.

Disruptive risk – These risks result from loss of supply or supplier capacity, typically driven by some disruptive event.

Exogenous risk – These risks arise within the operational environment and are process driven (e.g. poor quality control, design flaws, etc.), usually within the direct influence of the firm. They typically require the use of preventive mechanisms for control.

Endogenous risk – These risks originate externally, either from the supply side or demand side, which may not necessarily be under a firm’s direct influence. They typically involve the use of responsive mechanisms for control.

While many classification attempts have been noble in nature, in the end it is difficult to classify risks according to a single scheme, for a variety of reasons. First, the lines of demarcation between risk categories can be blurred and there could be overlap between them. For example, from the above categories, one can easily argue about the differences between exogenous and recurring risks. Second, every firm is different, and thus one framework may not fit all. Finally, risk methodology approaches may differ somewhat across various industries, as evidenced by different industry best practices and standards for risk analysis.

Supply chains can exhibit many kinds of vulnerabilities, but quite often these can be viewed as either structural or procedural in nature. Structural vulnerabilities stem from deficiencies in how the supply chain is organized, provisioned and engineered. Single points of failure can arise when there is insufficient diversity across suppliers, product sources or the geographical locations of sources. Inadequate provisioning can create shortages in inventory or capacity to meet customer demands. Procedural vulnerabilities stem from deficiencies in business or operational processes. Gaps and oversights in planning, production or transport processes could adversely affect a firm’s ability to respond to customer needs. Insufficient supply chain visibility could render a firm blind to oversights in supplier vetting and management practices, quality assurance and control, or demand planning.

Such kinds of vulnerabilities, combined with an aforementioned hazardous condition, results in the supply chain failing in some fashion. Table 1 illustrates some of the more common modes of supply chain failure.

Table 1 – Common Supply Chain Failure Modes

Degraded fill rate

Degraded service level

High variability of consumption

Higher product cost

Inaccurate forecasts

Inaccurate order quantity

Information distortion

Insufficient order quantities

Longer lead times/delays

Loss of efficiency

Lower process yields

Operational disruption

Order fulfillment errors

Overstocking/understocking

Poor quality supplied

Supplier stock out


Ultimately, such supply chain failures result in increased costs, loss of revenue, loss of assets, or combination thereof. Common risks are typically assessed as increases in ordering costs, product costs, or safety stock costs. Product stock out losses can be assessed as backorder costs or loss of sales and business revenue. Different kinds of firms will be prone to different types of risks. For example, a manufacturing firm with long supply chains will be more susceptible to ordering variability (or bullwhip) types of effects versus a shorter retail supply chain which would be more sensitive to fill rate and service level variability. Understanding and characterizing these risks is necessary in order to develop strategies to control or manage them. Quantifying risks provides the decision maker with a gauge to assess risk before and after a control is applied, thereby assessing the prospective benefit of a potential control. Using quantified risk values, in combination with other parameters, enables a decision maker to prioritize potential control strategies according to their cost-effectiveness.

Conclusions

Risk is the chance or the probability of a loss or unwanted negative consequence. Inherent supply chain weaknesses such as sole sourcing, process gaps or lack of geographical sourcing diversity can render a supply chain more vulnerable to some hazardous, unforeseen condition or trigger event, such as a strike or major storm, resulting in undesirable increases in costs, asset loss or revenue loss. Such risks can be quantified to some extent, quite often in monetary units, and can be used to facilitate cost-benefit analysis of potential control strategies. In our next article, we will take a look some of the most favored strategies to control supply chain risk.

AmickBrown.com

Bibliography

Chopra, S., and M. Sodhi. “Managing Risk to Avoid Supply-Chain Breakdown.” MIT Sloan Management Review, 2004: 53-61.

Gupta, G., V. Kumar Sahu, and A. K. Khandelwal. “Risks in Supply Chain Management and its Mitigation.” IOSR Journal of Engineering, 2014: 42-50.

Harland, C., R. Brenchley, and H. Walker. “Risk in Supply Networks.” Journal of Purchasing & Supply Management, 2003: 51-62.

Monroe, R. W., J. M. Teets, and P. R. Martin. “A Taxonomy for Categorizing Supply Chain Events: Strategies for Addressing Supply Chain Disruptions.” SEDSI 2012 Annual Meeting Conference Proceedings. Southeast Decision Sciences Institute, 2012.

Peck, H. “Drivers of Supply Chain Vulnerability.” International Journal of Physical Distribution & Logistics Management, 2005: 210-232.

Tummala, R., and T. Schoenherr. “Assessing and Managing Risks Using the Supply Chain Risk Management Process (SCRMP).” Supply Chain Management: An International Journal, 2011: 474-483.


The Nature of Supply Chain Risk

Contributed by Matthew Liotine, PHD

In our last article, we looked at the magnitude of the supply chain risk problem and how it is a major concern for most companies – large or small. Studies have shown that most companies experience one or few supply chain disruptions annually, each resulting in some significant loss. Many of these disruptions involve key suppliers or those below Tier 1. Never the less, many firms still lack commitment to controlling supply chain risk for the reasons of the costs and complexity involved. Consequently, many firms will tend to favor short term ROI solutions versus longer-term solutions that involve investing capital to improve both their supply chain infrastructure and operational resilience. Larger firms will manage risk more strategically using a combination of executive governance and/or data driven approaches. While operational data is increasingly becoming more available, much work is still needed in leveraging such data for strategic risk management. The nature of risk in the supply chain lies with a firm’s exposure to potential disturbances to the supply chain operation. Many of these disturbances can be manifested in various ways, usually in the form of single, multiple or recurring events, conditions or phenomena. In this article, we will examine what kinds of hazards, events or triggers can possibly compromise supply chain weaknesses and can ultimately threaten supply chain operations.

The Changing Nature of Threats

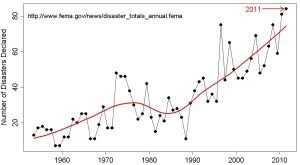
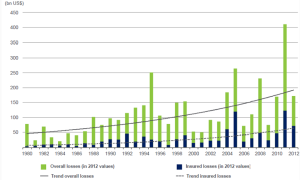
When one thinks about threats to a supply chain, natural disasters usually first come to mind. Figure 1 shows the trend in major U.S. disaster declarations as reported from the Federal Emergency Management Administration (FEMA, 2011). While it is clear that there has been a rising trend in declarations, the reasons may vary from the increase in severe weather events due to climate change, to political influences. Figure 2 shows a trend in worldwide natural catastrophes (Munich RE, 2014).

SC chart 1

Figure 1 – Trend in U.S. Disaster Declarations

SC chart 2

Figure 2 – Trend in Worldwide Natural Catastrophic Losses

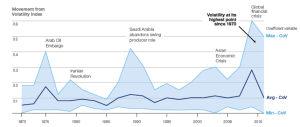
As evident in the Figure, there’s an ever growing trend in measured losses. While natural catastrophes have been occurring since the beginning of time, their effects over the years have been more far reaching due to population growth and insurability trends. These trends, combined with human created disruptions, together have created an environment of increased volatility for supply chains, as depicted in Figure 3 (Martin & Howleg, 2011).

SC Chart 3

Figure 3 – Trend in Supply Chain Volatility

This Figure shows the annual volatility in a composite set of key business parameters such as exchange rates, interest rates, shipping costs and raw material prices. They are combined into a single volatility index using the coefficient of variation (CoV) of the business indices representing these parameters to produce a normalized volatility metric. While in the far past there has been a timely return to supply chain stability following adverse events, the recent increase in volatility bandwidth questions whether this trend would likely continue. The high collective swings (versus individual swings) in key business parameters, which may be correlated with each other, suggests that an alternative approach to designing supply chains and managing supply chain risk might be preferred.

Volatility can arise from many possible undesirable hazards, conditions or trigger events. The likelihood of such events compromising a supply chain’s vulnerability is regarded as a threat. Table 1 lists categories of possible threat sources and examples within each category. The list was compiled from several studies and is not meant to be all-inclusive (Tummala & Schoenherr, 2011) (World Economic Forum, 2012) (Accenture and World Economic Forum, 2013) (Chopra & Sodhi, 2004).


Table 1 – Supply Chain Threat Sources

Disruptions

  • Natural disasters
  • Terrorism and wars
  • Labor disputes/shortage
  • Single source of supply
  • Insufficient supplier capacity or responsive
  • Extreme Weather

Capacity

  • Capacity inflexibility
  • Capacity cost increase
  • Geographical concentration
  • Insufficient capacity

Information System

  • Over-reliance on systems
  • Information infrastructure outages
  • Insufficient system/network integration
  • Incompatible IT platforms
  • Unavailable data/information
  • Inaccurate data/information

Sovereign Regional instability

  • Conflict & political unrest
  • Government regulations
  • Loss of control
  • Intellectual property breaches
  • Corruption
  • Export/import restrictions
  • Illicit trade & organized crime
  • Ownership/investment restrictions

Strategy & Operations

  • Lean processes
Demand/Customer

  • Frequent changes in demand
  • Sudden unforeseen demand surges/dips

Process Design changes

  • Communication gaps
  • Inaccurate specifications
  • Supplier non-compliance

Procurement Unqualified supplier

  • Inflexibility of supplier
  • Poor supplier quality or process yield
  • Supplier insolvency
  • Rate of exchange
  • Flawed supplier’s sourcing
  • Commodity price volatility
  • Global energy shortages
  • Lack of supplier transparency

Transportation Paperwork and scheduling

  • Strikes
  • Port capacity/congestion
  • Higher costs of transportation
  • Piracy
  • Infrastructure failures
  • Excessive handling
  • Custom clearances at ports
  • Border delays
  • Transportation breakdowns

Structural Fragmentation along the supply chain

  • Extensive subcontracting
  • Dependency on a single source of supply
  • Extensive outsourcing
  • Extensive offshoring
  • Product/supply network complexity


The Changing Course in Risk Management

Many supply chains are designed under the assumption of operating in stable environment (Martin C. H., 2011). While approaches such as Just-in-Time (JIT) and product-focused production are designed to minimize variation, maximize efficiency and ultimately reduce costs, they require a more rigid command-control management strategy which may not necessarily respond well in a volatile environment. In addition, the effects of volatility can be further amplified in a rigid supply chain that lacks resiliency. Building supply chain resiliency may counter the notion of an efficient operation, since it requires the addition and re-allocation of capacity, inventory and other resources that could serve as shock absorbers to withstand disruption. Since these controls will entail added costs, the use of a risk analysis methodology would be an effective tool in helping firms identify, evaluate and prioritize the most cost-effective risk-control options. It was clearly evident in Table 1 that there can be numerous sources of threats to a supply chain. However, since many threats can have similar outcomes on a supply chain operation, control options can be devised using an “all hazards” philosophy, which entails implementing controls to minimize the common effects of multiple threats or threat categories.

Conclusions

Supply chain disruptions can arise from many sources, both natural and man-made. Current trends indicate a continued rise in measured losses from natural events and increased business volatility in response to man-made events. Traditional supply chain structures designed for operational efficiency may not necessarily be able to withstand disruptions arising from numerous threat sources. Creating a more resilient supply chain may require the use of risk assessment tools and methods to help decision-makers identify the most cost effective controls that could minimize the common effects arising from multiple threats. In the next article, we will examine some common supply chain vulnerabilities and their ensuing risks.

Bibliography

Accenture and World Economic Forum. (2013). Building Resilience in Supply Chains. Accenture.

Chopra, S., & Sodhi, M. S. (2004). Managing Risk To Avoid Supply-Chain Breakdown. MIT Sloan Management Review, 46(1), 53-61.

FEMA. (2011). Democratic Blog News. Retrieved from http://www.demblognews.com/2011/09/water-development-board-report-says.html

Martin, C. H. (2011). Supply Chain 2.0: Managing Supply Chains in the Era of Turbulence. International Journal of Physical Distribution & Logistics Management, 41(1), 63-82.

Martin, C., & Howleg, M. (2011). Supply Chain 2.0: Managing Supply Chains in the Era of Turbulence. International Journal of Physical Distribution & Logistics Management, 41(1), 63-82.

Munich RE. (2014, January). Topics Geo: After the Floods. Munchen: Munich RE.

Tummala, R., & Schoenherr, T. (2011). Assessing and Managing Rrisks Using the Supply Chain Risk Management Process (SCRMP). Supply Chain Management: An International Journal, 16(6), 474–483.

World Economic Forum. (2012). New Models for Addressing Supply Chain and Transport Risk. World Economic Forum.

Reimagine Predictive Analytics for the Digital Enterprise

future_predictive_analytics_SAPPHIRENOW

As part of a broad announcement made at SAPPHIRE NOW 2016, SAP announced a range of new features and capabilities in its analytics solutions portfolio. Because predictive capabilities play an important role in the portfolio, I thought I’d take this opportunity to share the details of our innovations in both SAP BusinessObjects Cloud and SAP BusinessObjects Predictive Analytics.

Innovations in SAP BusinessObjects Cloud

Predictive analytics capabilities have been added to the SAP BusinessObjects Cloud offering. Business users can use an intuitive graphical user interface to investigate business scenarios by leveraging powerful built-in algorithmic models. For example, users can perform financial projections with time series forecasts, automatically identify key influencers of operational performance, and determine factors impacting employee performance with guided machine discovery.

Learn more about our predictive capabilities in SAP BusinessObjects Cloud.

Innovations in SAP BusinessObjects Predictive Analytics

Predictive analytics features that aim to help analysts easily deliver predictive insights across an enterprise’s business processes and applications are planned for availability in the near term.

Planned innovations include:

  • Automated predictive analysis of Big Data with native Spark modeling in Hadoop environments
  • Enhancements for SAP HANA including in-database social network analysis and embedding expert model chains
  • A new simplified user interface for the predictive factory and automated generation of segmented forecast models
  • Integration of third-party tools and external processes into predictive factory workflows
  • The ability to create and manage customized models that detect complex fraud patterns for the SAP Fraud Management analytic application

Learn more about what SAP Predictive Analytics has in store.

Upcoming Release of SAP Predictive Analytics

Watch the video about our upcoming release of SAP Predictive Analytics for more information.

Thank you to Pierre Leroux, Director, Predictive Analytics Product Marketing, SAP for writing this informative article.

AmickBrown.com


The Human Aspect of Predictive Analytics

By Ashith Bolar , Director AmBr Labs, Amick Brown

The past decade and a half has seen a steady increase in Business Intelligence (BI). Every company boasts a solid portfolio of BI software and applications. The fundamental feature of BI is Data Analytics. Corporations that boasts large data do indeed derive a lot of value from their Data Analytics. A natural progression of Data Analytics is Predictive Analytics (PA).

Think of data analytics as a forensic exercise in measuring the past and the current state of the system. Predictive Analytics is the extension of this exercise: Instead of just analyzing the past and evaluating the current, predictive analytics applies that insight to determine, or rather shape the future.

Predictive Analytics is the natural progression of BI.

The current state of PA in the general business world is, for the most part, at its inception. Experts in the field talk about PA as the panacea – as the be-all and end-all solution to all business problems. This is very reminiscent of the early stages of BI towards the turn of the century. Hype as it may be, BI did end up taking the center stage over the ensuing years. BI was not the solution to the business problems anymore; it was indeed mandatory for the very survival of a company. Companies don’t implement BI to be on the leading-edge of the industry anymore. They implement BI just to keep up. Without BI, most companies would not be competitive enough to survive the market forces.

Very soon, PA will be in a similar state. PA will not be the leading-edge paradigm to get a headstart over other companies. Instead PA is what you do to just survive. All technologies go through this phase transition – from leading-edge to must-have-to-survive. And PA is no different.

predict the future

Having made this prediction, let’s take a look at where PA stands. Some industries (and some organizations) have been using predictive analytics for several decades. One such not-so-obvious example is the financial industry. The ubiquity of FICO scores in our daily lives does not make it obvious, but they are predictive analytics at work. Your fico score predicts, with a certain degree of accuracy, the likelihood of you defaulting on a loan. A simple number, that may or may not be accurate in individual cases, arguably has been the fuel to the behemoth economic machinery of this country, saving trillions of dollars for the banking industry as well as the common people such as you and me.

Another example would be that of the marketing departments of large retail stores. They have put formal PA to use for several years now, in a variety of applications such as product placement, etc. If it works for them, there is no reason it should not work for you.

This is easier said than done. Implementing Predictive Analytics is not a trivial task. It’s not like you buy a piece of software from the Internet, install it on a laptop, and boom – you’re predicting the future. Although I have to admit that that is a good starting point. Implementing the initial infrastructure for PA does require meticulous planning. It’s a time-consuming effort, but at this point in time, a worthy effort.

Let’s take a look at high-level task list for this project

  1. Build the PA infrastructure
  2. Choose/build predictive model(s)
  3. Provision Data
  4. Predict!
  5. Ensure there’s company-wide adoption of the new predictive model. Make PA a key part of the organization’s operational framework. Ensure that folks in the company trust the predictive model and not try to override it with their human intelligence.

Steps 1 thru 4 are the easy bits. It’s the 5th step that requires a significant effort.

Most of us have relied on our superior intellect when it comes to making serious decisions. And most of us believe that such decision-making process yields the best decisions. It is hard for us to imagine that a few numbers and a simple algorithm would yield better decisions than those from the depths of our intellect.

However, it is important to change your organization’s mindset about predictive analytics. If you are considering your business to be consistently run on mathematical predictive models, acceptance from the user community is crucial. Implementing PA is a substantial effort in Organizational Change Management.

Remember the financial services industry. They don’t let their loan officers make spot decisions on the loan-eligibility of their clients based on their appearance, style of speech or any such human sensory cues. Although, if you ask the loan officer, they might claim to be better judges of character – the financial industry does not rely on their superior human intellect to measure the risk of loan default. Generally, a single 3-digit number makes that decision for them.

The next time you go to the supermarket for a loaf of bread, and return with a shopping cart full of merchandise that you serendipitously found on the way back from the bread aisle including the merchandise along the cash-counter, you can thank (or curse) the predictive analytics employed by the store headquarters located probably a thousand miles away from you.

AmickBrown.comGet What You Expect

The Time to Change is Now

clock_calendar_moneyThe world is speeding ahead at a significant pace towards a major revolution—the data-driven economy.  Several data-driven start-ups in the last decade have become large corporations (Google, Facebook, Twitter), with billions of people reached and influenced by their innovations. Here is a list of the hottest start-ups that are looking to mature to the big league.

As the momentum is picking up, major organizations from different industry verticals are in a quest to exploit the opportunities that have arisen from the humongous amount of data that their business generates, directly and indirectly. Philip Evans, Senior Partner, Boston Consulting Group, discussed in his TED talk what businesses would look like in the future, and the impact that Big Data will have on business strategies.

Whether businesses want to use data to make the world a better place, to understand the wishes of customers before they’re expressed, to be more proactive than reactive in decision making based on predictive technologies, or something else, there are several challenges that we must all face.

These challenges include the following.

  1. Data volumes are ever-increasing. Most of the data is unstructured (either textual, videos, graphs and so on) rather than transactional and structured.
  2. The decision cycles are becoming shorter. We expect millisecond response times from the systems we interact with. And with mission-critical applications, the response time could be even shorter.
  3. Thousands of predictive models are required to get coverage of all the predictive scenarios that an application can create.
  4. Traditional methods of modelling are very time-consuming. The quest to find a perfect model drains valuable time and money before it can be put to business use.
  5. The knowledge workers who understand data science, and who could mine useful actionable nuggets from the data, are rare. The demand for such skilled workers is ever-increasing and their lack of availability is causing a massive skills gap.

With Challenges Comes Opportunities

However, with challenges come opportunities.

Consider the Industrial Revolution. As we know, at that point in history the move was to automate processes that were repetitive or required more manual effort, and find ways to free valuable resources—the brain and imagination—that we use to focus on even larger problems. The result is the modern world we now live in.

Now the data revolution is demanding a new change. That is, the way in which we work with data. We must find ways and means to automate most of the repetitive workflows and modelling processes that are applicable industry-wide. This way, we can free the very valuable time of the data scientist to focus on tough problems that cannot be solved without human intervention.

With several thousand models that enable a data-driven company to run, it’s also important to have capabilities that enable the company to monitor the performance of these models in real time. This means decommissioning the models that exhibit significant deviation in performance, as compared to when they were deployed on production systems.

This paves the way for the need of a Massive Predictive Factory, a single source of truth and heart-beat monitor for the entire organization.

For more on Predictive Analytics, Follow Amick Brown

Customer Analytics – Predictive at the Center of Everything You Do

crystal-ballAs we discussed earlier, digital transformation is about taking a holistic approach to transforming the customer experience in all aspects. In this way, you fundamentally create new business models where the convergence of physical and digital occurs at the highest level.

In today’s quickly changing and evolving digital marketplace, there are a few macro trends that you see.  The purchase path is not linear, customer engagement occurs through many touch points, and customers expect each interaction to be relevant and personalized.

The rules of engagement are changing and businesses are no longer the first stop for customers when they want to inform themselves.  People now turn to their networks to get information and recommendations. To meet the expectations of your customers today, you need to go beyond the traditional approach of acquiring and retaining customers.

The goal today is to deliver an amazing customer experience at every interaction so that you not only acquire and retain customers, but you also gain  customers who become your loyal fans, your outspoken advocates. This all boils down to the fundamental question,

How can I personalize every customer interaction across multiple channels in real time by analyzing Big Data?

This leads to transforming the operating models to a more customer-centric, integrated organization using data and analytics as the basis for decision making. The transformation can be started with very simple questions:

  • Who are my “best” customers?
  • Who should I target for promotion?
  • How should I vary my promotion to different customers?
  • What product should I sell at what channel and at what price?
  • How should I keep the supply and demand in absolute balance?

A series of predictive models for each one of these questions will establish a framework to manage the customer life cycle. To achieve this, you  use a variety of techniques, such as segmentation, link analysis, propensity, forecasting and more.

What do you think? We look forward to hearing from you.

See more about Amick Brown , SAP Silver Services Partner


Predictive Analytics 101 – The Real Business Intelligence, part 2

by Ashith Bolar,  Director AmBr Data Labs @ Amick Brown

In my first post, “The Real Business Intelligence” ,  I emphasized on the significance of Predictive Analytics in the Business Intelligence space.  Let us take a deeper look at Predictive Analytics by way of more concrete examples.

As a refresher, Predictive Analytics is a set of tools and techniques based on statistical and mathematical techniques to analyze historical data and subsequently predict the future. The basic premise is that by analyzing historical data, determining relationships, more specifically correlations between related (and sometimes seemingly unrelated) attributes and entities, one can derive significant insights into a system. These insights can be further used to make predictions.

Let’s take a look at this process step by step.

The fundamental component in Predictive Analytics is a Predictive Model, or just model. A Predictive Model is set of data points plus a series of algorithms working on that data. It attempts to capture the relationships between the data points by means of applying mathematical or statistical computations deployed as algorithms.

The output of a model is typically a single number — called a score. The score essentially is an quantitative value for a specific prediction by the model based on historical data. Higher the score, the more likely a certain behavior is predicted. Lower the score, the more likely the opposite behaviour is predicted.

Predictive models can be built for a wide variety of problems. But the most common predictive models, especially in the context of a business application, is one that predicts people’s behaviors. Predictive models are designed to predict how people behave under new circumstances, given what we know about how they behaved in the past with other known circumstances. For instance, Netflix’s movie recommendations — based on the movies that you have seen and rated highly (known circumstances) recommendations for new movies (unknown circumstances) are generated.

You will hear terms like “Machine Learning”, “Artificial Intelligence”, “Regression Analysis”, etc. While, each one is an independent area of mathematics and computing, for a Predictive Analytics suite, these are just different algorithms (computing models) that are employed in the process of predicting.

Let’s dig deeper into the concept of Scores. Let’s take two classical examples of scores generated on customers.

  1. Based on the movies you have seen and rated in the past, Netflix tries to determine if you will like a new movie or not. Say for instance, a scoring of 0-10: 10 being a prediction of you absolutely loving the new movie, and 0 being a prediction of you absolute not caring about it. This type of a score is called a Probability Score. In essence, the score tells you the probability of you liking a movie.
  2. Another type of score is called the Quantitative Score. Here the prediction is not the probability of whether you will like the movie or not, instead to quantitatively predict the amount of something. For instance, Life Insurance companies try to predict how long a certain customer will live based on the life choices and other circumstances of the customer.

In case of the Netflix model (Probability Score), if a customer gets a 8 (out of 10) for the likelihood of liking a particular movie, it can be rephrased as “There’s a 80% chance that the customer will like this movie, and a 20% chance that they will not like it”. Such a prediction is basing its prediction on the spread of probabilities (probability distribution). Another way of looking at this score of 8 (out of 10 is) “The customer might not absolutely love this movie (which would be a 10/10), but definitely not absolutely hate the movie (0/10). Instead the customer is more likely actually liking the movie to some extent (8/10), rather than completely disinterested (5/10).

In either case, a careful examination of this score tells us that all the system is doing is categorizing people’s behaviours into a set number of ranks. Therefore, predictive models which generate probability scores are usually called classification models. On the other hand, the quantitative scoring (predicted life expectancy of an insurance customer) is really a quantitative number. Another classic example is customer spend which is how much a customer is willing to pay for a new product or service. The actual value is reached at by means of various statistical and mathematical computations. These models are typically known as regression models.

A good predictive model might not be accurate in every single case, but given a large set of data (read target customers), the model regresses to the predicted mean of the behavior.

In the following posts, we will delve deeper into predictive algorithms, and try to gain a better understanding of how they work, and more importantly why they work, and why they are important in your corporate strategy.


The Real Business Intelligence

Ashith Bolar, Director of Research, Amick Brown

In the state of the art of computing, every company generates a large amount of data, and it goes without saying that every organization does some sort of data analysis on this data. Big and small companies invest in Business Intelligence in some shape or form. The ubiquity of big data infrastructures, such as those from SAP, as well as Hadoop and its various distributions also has enabled even smaller and medium sized businesses (SMB) to perform data analytics at scale.

glass wall meeting

Loosely speaking, Business Intelligence (BI) is a set of techniques and tools used to transform raw data into meaningful and actionable information. However, simply based on that definition, virtually every exercise in data analytics can be considered as Business Intelligence. The true value of a BI is only realized when the latest tools and technologies are applied in order to determine the historic, current and predictive views of the business.

One of the applications of BI is Predictive Analytics (PA). PA encompasses a large and fluid set of tools based on statistical and mathematical techniques to analyze historical data and subsequently build predictive models. The idea is that historical data contains patterns that, if recognized and correctly applied, can be used in predicting the future. This enables a company to predict and proactively respond to the future state of the business, say customer behavior, market conditions, etc.

growth graph

Take a look at your current BI system. Are you only analyzing  historical data, and at best enumerating the current state of your business? Or does your Business Intelligence platform help you model the future and enable you to predict the course of your business? Are you able to identify risks and opportunities well before they occur?

PA captures patterns and relationships among the various factors in your business, giving you a deeper perspective of risks or potentials associated with your current course of business. This enables you to make optimal changes to your business in order to make the most of the current and future market conditions.

Current technology offers very cost-effective means of Predictive Analytics that SMBs could implement with virtually no upfront cost.  SAP’s Predictive Analytics Software gives you a robust set of tools in this space. These tools run on your enterprise data and any supplementary data that you provide.

SAP’s Predictive Analytics Library (SAP-PAL) provides the following list of capabilities:

  • Predictive Modeling : automated set of tools to build predictive models
  • Predictive Scoring : identify and evaluate relevant variables in predicting
  • Predictive Model Management : enable end-users with limited knowledge of the science of predictive analytics to ask what-if questions
  • Predictive Network and Link Analysis : explore the links between your customers and network of strong social influencers with analytics
  • Predictive Data Management : automated data-set preparation for predictive modeling

Amick Brown can help you realize the predictive powers that you have with your SAP and BI platform provides you.