Tag Archives: visualization

What if Beethoven and Mozart Invented Their Own Notation System

sheet_music_violinTo appreciate how semantic notation can impact your business, take a step back for a moment and imagine if every composer from Mozart to Beethoven used a different notation system. How would conductors and musicians interpret the music in a moment without standardized notation? What if engineers didn’t have a standardized notation system? Most likely they wouldn’t be able to communicate vast amounts of information clearly and quickly.

Yet in business, there is an overabundance of ways to layout out corporate reports and dashboards. And even within a single company, you will find forecast data or averages defined and displayed differently. But with pattern recognition, you can immediately understand the context of that information. This is the essence of a standard notation system, which brings clearer, data-driven insights and faster visualization turnaround.

Communicate Vast Amounts of Data-Driven Insights with Clearer, More Aligned Messages

Executives can  digest and act on visual data faster when it is always laid out the same: forecast, averages, historical and all metrics always looks the same and are in the same layout. People learn quickly to recognize patterns, and this is helpful to interpreting volumes of data. Critical to good business decision-making is the ability to portray very dense amounts of information, while maintaining clarity. This is vital when extrapolating multiple metrics for data to understand how it relates to the business.

A visualization that shows a percentage breakdown of revenue into products is, in itself, not very useful. To act and make better decisions, you need to understand how revenue has changed over time and to compare it to other product lines, the budget, profit margin, and market share. Also, executives spend less time trying to align the data into one version of the truth when all metrics are calculated and portrayed using the same standards across all business units. Having a standard notation system in your business can help you foster data-driven culture and alignment for better decision making. 

Faster and Improved Visualization of Analysis and Insights

Although content creators spend less time inventing their own system and layout, they still follow guidelines. In speaking with people who have adopted international business communications standards (IBCS), they found, for example, that the average time to create dashboard dropped three-fold. Through standard notation systems, they shortened implementation times and improved the outcome of their analytics investments.

Don’t Start from Scratch – These Are Best Practices

One of the best-developed, semantic notation systems – which was only chosen by the SAP Executive Board back in 2011 – is based on an open source project called International Business Communications Standards. Anyone can join the association and benefit from years of thought leadership and best practices developed over decades. Plus, the community is included in the evolution of these standards.

Register for the Standards Course

OpenSAP allows you to learn anywhere, anytime and on any device with free courses open to the public.

This blog orignially appeared on the  D!gitalist Magazine by SAP and SAP Business Objects Analytics blog has been republished with permission.


“Passionate on Analytics” , new book available

from Iver van de Zand

My book “Passionate On Analytics” is available now

Driven by a deep believe of the value of business analytics and business intelligence in the era of Digital Transformation, the book explains and comments with insights, best practices and strategic advices on how to apply analytics in the best possible way. 25 Years of analytics hands-on experience come together in one format that allows any analytics userHow proud can one be?

My first book titled “Passionate on Analytics” is now available from the Apple iBooks Store via this link.

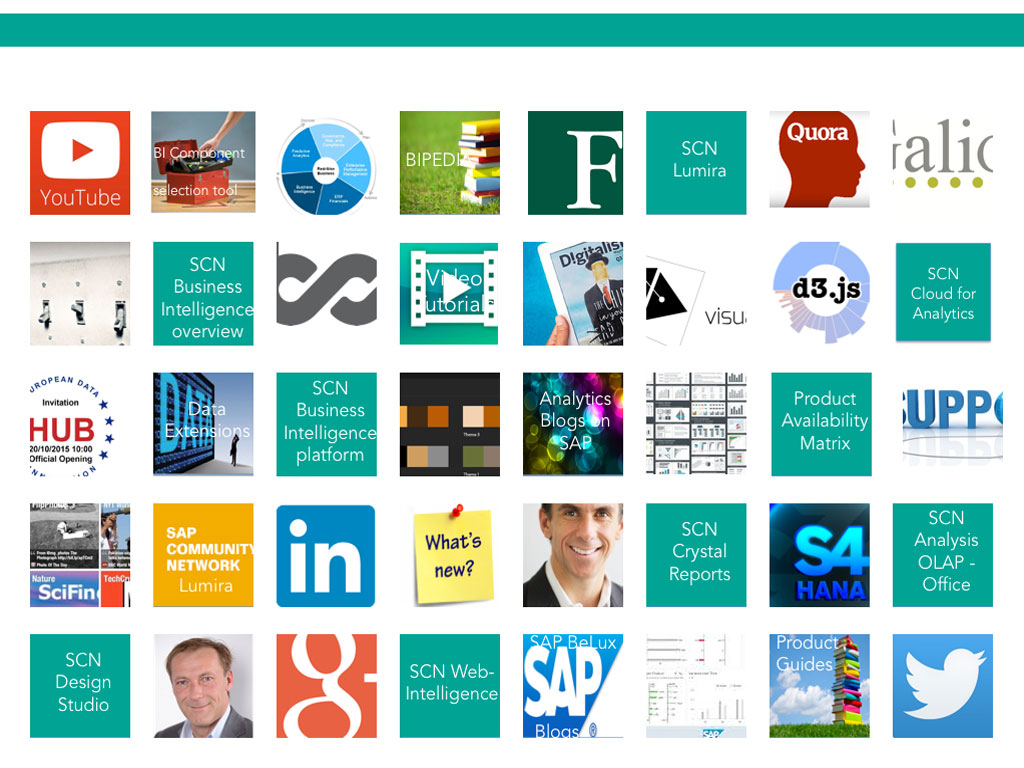
Since I am evangelizing on interactive analytics every single day, I decided to create aninteractive ePub book. It contains over 60 best practice and tutorial videos, tons of valuable links and galleries and 33 extended articles providing insights on various analytics related topics.

Passionate on Analytics (206p) has 4 sections:

  1. Insights: 13 deep dive articles on various aspects of business analytics like industry specific approaches, embedded analytics and many more
  2. Strategy: 13 chapters talking analytics strategy related subjects and topics like defining your BI roadmap or the closed loop portfolio
  3. Best Practices: 10 expert sessions showing and demonstrating best practices in business analytics like using Hitherto charts, how to make a Pareto or visualization techniques
  4. Resources: a wealth (!) of resources on analytics

Please find below some screenshots.

I am very happy with the book with has brought up the best in me. Everything I learned, experienced or discussed during my 25 years tenure in business analytics, is expressed in this book. The book is fully interactive meaning you can tap pictures for background, swipe through galleries or start an tutorial video.

Special thanks goto Ty Miller, Timo Elliott, Patrick Vandeven and Waldemar Adams who I all admire a lot.

Iver


The Closed Loop portfolio in Analytics

The Closed Loop portfolio in Analytics

Authored by Iver van de Zand, SAP

We talked about the overwhelming power of analytics in Retail and B2C market-segments earlier and one of the topics discussed there, was the integration of operational business activities with operational analytics. In the example we saw the stock manager using analytics to change his stock-buying-behavior. He adjusted his order system by choosing another vendor and placing the order. Immediately his analytics are updated and he now requires to adjust his rolling planning or run a predictive simulation how the price-adjustment of his new stock might affect buying behavior of his customers. He might even want to adjust the governance rules with his new supplier or run a risk-assessment.


Below pictures visualizes the continuous integration of core business activities with business analytics, indicating examples of core processes with their accompanying analytical perspectives. These are just examples and not exhaustive at all.


Performance Management closed loop

Basically what the stock manager in our example needs, is a full – real-time – integration of business analytics with his core business activities over all aspects of his performance management domain. A predictive simulation of changing buying behavior lead to new analytical insights on product mix which might influence the companies’ budget and causes a risk analysis for new vendors.

To do so, a closed loop is required of following core components driven by the continuous flow of Discover – Plan – Inform – Anticipate:

  • online Analytics on big data with interactive user involvement
  • ability to adjust and monitor a rolling Planning for budgets, forecasts. A planning that that allows for delegation and distribution from corporate level into lower levels
  • GRC software to perform risk analyses on for example vendors or suppliers
  • online Predictive analyses components to apply predictive models like decision trees, forecasting models or other R algorithms. Predictive analyses allow to look for patterns in the data that “regular” analytics is not able to discover. The scope of predictive analytics is gigantic: think not only sentiment analyses for social media, but also basket analyses in retail markets, attrition rates in HR and many, many more.


This so-called closed loop of predictive analytics, planning and performance management, business analytics and GRC is NOT a sequential process at all. They interact randomly towards each other in real-time and at any moment needed. They are also dependent towards each other, since Digital Transformation requires us to be so agile, we have to constantly execute and collaborate on the interoperability of the components and monitor the outcome. Lastly, the closed loop platform interacts on core operational activities (real-time insights in operational data) and as such the analytics are defined as Operational Analytics.

Closed loop platforms more than anything else require business users to drive its content and purpose. They drive the agility to the platform that is so heavily needed in the Digital Transformation era. On the other hand the technical driven architects do make a difference too, since closed loop platforms are very sensitive to respect governance principles. A special role is allocated to the CFO or Office of Finance here; they will drive the bigger part of the Planning and Budgeting cycle.

One can imagine the calculation processes behind the closed loop platform are huge and therefor a business case for an in-memory system is a sine qua non.

Imagine the possibilities

Needless to say that the closed loop model applies to all industries and not only in the retail example that I used here. I can list plenty of examples here but just to name a few:


  • HR: attrition rates of employees
  • Banking & Insurance: customer segmentation, product basket analyses
  • Telco & Communications: churn and market segmentation nut also network utilization
  • Public Government: Fraud detection and  Risk-Mitigation
  • Hospital: personalized healthcare

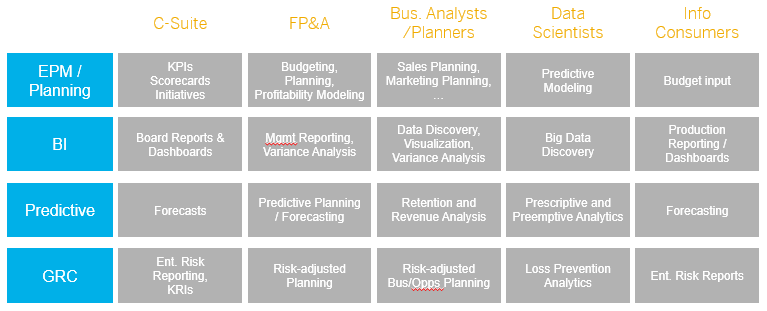
Apart from imagining the possibilities per market segment, we can also change perspectives and look at the possibilities per role within companies applying the closed loop platform. Below picture provides capabilities the closed loop components could offer to various user communities. The potential is huge and extremely powerful when used in an integrated platform. This is also the weaker point of the closed loop platform: the components must be integrated not to miss their leveraging effect on each other.

A solution is available today

With its Cloud for Analytics offering, SAP is today the only provider with an integrated offering for the closed loop platform. Even more: SAP Cloud for Analytics is integrated in one tool offering analytics, planning, GRC and predictive capabilities. One tool?? …. Yes, one tool completely Cloud driven and utilizing the in-memory HANA Cloud Platform it is running on. One tool that seamlessly lets analytics and planning interact with each other. A tool where you can run your predictive models and analyses and visualize the outcome with the analytics section. A tool that allows access to both your on premise data, your Cloud data and/or Hadoop stored data. And lastly a tool with fully embedded collaboration techniques to share your insights with colleagues but also involve them with planning or others.  Our dream becomes reality.