Category Archives: Analytics

The Human Aspect of Predictive Analytics

By Ashith Bolar , Director AmBr Labs, Amick Brown

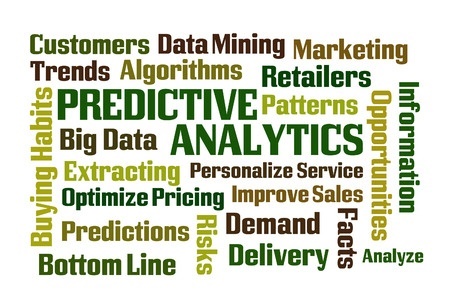
The past decade and a half has seen a steady increase in Business Intelligence (BI). Every company boasts a solid portfolio of BI software and applications. The fundamental feature of BI is Data Analytics. Corporations that boasts large data do indeed derive a lot of value from their Data Analytics. A natural progression of Data Analytics is Predictive Analytics (PA).

Think of data analytics as a forensic exercise in measuring the past and the current state of the system. Predictive Analytics is the extension of this exercise: Instead of just analyzing the past and evaluating the current, predictive analytics applies that insight to determine, or rather shape the future.

Predictive Analytics is the natural progression of BI.

The current state of PA in the general business world is, for the most part, at its inception. Experts in the field talk about PA as the panacea – as the be-all and end-all solution to all business problems. This is very reminiscent of the early stages of BI towards the turn of the century. Hype as it may be, BI did end up taking the center stage over the ensuing years. BI was not the solution to the business problems anymore; it was indeed mandatory for the very survival of a company. Companies don’t implement BI to be on the leading-edge of the industry anymore. They implement BI just to keep up. Without BI, most companies would not be competitive enough to survive the market forces.

Very soon, PA will be in a similar state. PA will not be the leading-edge paradigm to get a headstart over other companies. Instead PA is what you do to just survive. All technologies go through this phase transition – from leading-edge to must-have-to-survive. And PA is no different.

predict the future

Having made this prediction, let’s take a look at where PA stands. Some industries (and some organizations) have been using predictive analytics for several decades. One such not-so-obvious example is the financial industry. The ubiquity of FICO scores in our daily lives does not make it obvious, but they are predictive analytics at work. Your fico score predicts, with a certain degree of accuracy, the likelihood of you defaulting on a loan. A simple number, that may or may not be accurate in individual cases, arguably has been the fuel to the behemoth economic machinery of this country, saving trillions of dollars for the banking industry as well as the common people such as you and me.

Another example would be that of the marketing departments of large retail stores. They have put formal PA to use for several years now, in a variety of applications such as product placement, etc. If it works for them, there is no reason it should not work for you.

This is easier said than done. Implementing Predictive Analytics is not a trivial task. It’s not like you buy a piece of software from the Internet, install it on a laptop, and boom – you’re predicting the future. Although I have to admit that that is a good starting point. Implementing the initial infrastructure for PA does require meticulous planning. It’s a time-consuming effort, but at this point in time, a worthy effort.

Let’s take a look at high-level task list for this project

  1. Build the PA infrastructure
  2. Choose/build predictive model(s)
  3. Provision Data
  4. Predict!
  5. Ensure there’s company-wide adoption of the new predictive model. Make PA a key part of the organization’s operational framework. Ensure that folks in the company trust the predictive model and not try to override it with their human intelligence.

Steps 1 thru 4 are the easy bits. It’s the 5th step that requires a significant effort.

Most of us have relied on our superior intellect when it comes to making serious decisions. And most of us believe that such decision-making process yields the best decisions. It is hard for us to imagine that a few numbers and a simple algorithm would yield better decisions than those from the depths of our intellect.

However, it is important to change your organization’s mindset about predictive analytics. If you are considering your business to be consistently run on mathematical predictive models, acceptance from the user community is crucial. Implementing PA is a substantial effort in Organizational Change Management.

Remember the financial services industry. They don’t let their loan officers make spot decisions on the loan-eligibility of their clients based on their appearance, style of speech or any such human sensory cues. Although, if you ask the loan officer, they might claim to be better judges of character – the financial industry does not rely on their superior human intellect to measure the risk of loan default. Generally, a single 3-digit number makes that decision for them.

The next time you go to the supermarket for a loaf of bread, and return with a shopping cart full of merchandise that you serendipitously found on the way back from the bread aisle including the merchandise along the cash-counter, you can thank (or curse) the predictive analytics employed by the store headquarters located probably a thousand miles away from you.

AmickBrown.comGet What You Expect

The Time to Change is Now

clock_calendar_moneyThe world is speeding ahead at a significant pace towards a major revolution—the data-driven economy.  Several data-driven start-ups in the last decade have become large corporations (Google, Facebook, Twitter), with billions of people reached and influenced by their innovations. Here is a list of the hottest start-ups that are looking to mature to the big league.

As the momentum is picking up, major organizations from different industry verticals are in a quest to exploit the opportunities that have arisen from the humongous amount of data that their business generates, directly and indirectly. Philip Evans, Senior Partner, Boston Consulting Group, discussed in his TED talk what businesses would look like in the future, and the impact that Big Data will have on business strategies.

Whether businesses want to use data to make the world a better place, to understand the wishes of customers before they’re expressed, to be more proactive than reactive in decision making based on predictive technologies, or something else, there are several challenges that we must all face.

These challenges include the following.

  1. Data volumes are ever-increasing. Most of the data is unstructured (either textual, videos, graphs and so on) rather than transactional and structured.
  2. The decision cycles are becoming shorter. We expect millisecond response times from the systems we interact with. And with mission-critical applications, the response time could be even shorter.
  3. Thousands of predictive models are required to get coverage of all the predictive scenarios that an application can create.
  4. Traditional methods of modelling are very time-consuming. The quest to find a perfect model drains valuable time and money before it can be put to business use.
  5. The knowledge workers who understand data science, and who could mine useful actionable nuggets from the data, are rare. The demand for such skilled workers is ever-increasing and their lack of availability is causing a massive skills gap.

With Challenges Comes Opportunities

However, with challenges come opportunities.

Consider the Industrial Revolution. As we know, at that point in history the move was to automate processes that were repetitive or required more manual effort, and find ways to free valuable resources—the brain and imagination—that we use to focus on even larger problems. The result is the modern world we now live in.

Now the data revolution is demanding a new change. That is, the way in which we work with data. We must find ways and means to automate most of the repetitive workflows and modelling processes that are applicable industry-wide. This way, we can free the very valuable time of the data scientist to focus on tough problems that cannot be solved without human intervention.

With several thousand models that enable a data-driven company to run, it’s also important to have capabilities that enable the company to monitor the performance of these models in real time. This means decommissioning the models that exhibit significant deviation in performance, as compared to when they were deployed on production systems.

This paves the way for the need of a Massive Predictive Factory, a single source of truth and heart-beat monitor for the entire organization.

For more on Predictive Analytics, Follow Amick Brown

Predictive Analytics and the Segment of One

by Richard Mooney,                                           Product Manager, Advanced Analytics, SAP


Woman Buying Clothes --- Image by © Tim Pannell/CorbisOne of the areas that SAP is investing heavily in is the idea of providing ‘extreme customer experience’ to the ‘Segment of One.’  What does this mean for analytics? Traditionally, large enterprises split customers into multiple segments based on customer attributes that were then used to identify and classify customers.  These segments included their location, their current and potential spend, and which products and options they chose when they became a customer.

Marketers use these segments to determine which products they would market to which customers. Likewise, customer support applies different levels of service to each customer segment, and operations measures the profitability of each segment separately.

This is both highly frustrating to customers and an incredibly inefficient use of resources.

  • Every customer is different. They feel frustrated when their individual needs aren’t met, and their expectations about how they’re treated as customers are rising.
  • A one-size-fits-all approach doesn’t take into account the emerging customer acquisition and support channels that provide the potential to reduce the cost of service and market much more effectively. This includes mobiles applications, social networks, and the internet of things.
  • Because the cost of customer communication is plummeting, customers are inundated with content. They’re choosing to delete, unfollow and unsubscribe from content that doesn’t speak to them.

These same trends are opportunities. Companies are collecting far more information than ever before and the technology exists to leverage this at scale.  They no longer need to treat customers as being pure segments.  They can market to them personally, understand their likes and preferences, and give them services, all of which turns them into fans and advocates.

So How Do We Use Data to Connect to the Segment of One?

  • Make the Segment of One a corporate mandate. Communicate and service each customer as if it were a personal connection.
  • Rethink how your digital front office assets (including digital marketing, customer service and online) interact with customers to support this mandate.
  • Build a team of data scientists and data analysts to move from guesswork to data-driven decision making.
  • Build your customer communication around their analysis and deploy their work into every front office application. Measure and monitor the return on investment (ROI) from each initiative.

Done properly, this will result in happier customers and higher net promoter scores.   It also means that the data companies are collecting results in visible ROI, which improves their bottom line.

We would love to hear your thoughts on how the Segment of One will drive your data strategy.  Contact us or comment here to let us know.


Customer Analytics – Predictive at the Center of Everything You Do

crystal-ballAs we discussed earlier, digital transformation is about taking a holistic approach to transforming the customer experience in all aspects. In this way, you fundamentally create new business models where the convergence of physical and digital occurs at the highest level.

In today’s quickly changing and evolving digital marketplace, there are a few macro trends that you see.  The purchase path is not linear, customer engagement occurs through many touch points, and customers expect each interaction to be relevant and personalized.

The rules of engagement are changing and businesses are no longer the first stop for customers when they want to inform themselves.  People now turn to their networks to get information and recommendations. To meet the expectations of your customers today, you need to go beyond the traditional approach of acquiring and retaining customers.

The goal today is to deliver an amazing customer experience at every interaction so that you not only acquire and retain customers, but you also gain  customers who become your loyal fans, your outspoken advocates. This all boils down to the fundamental question,

How can I personalize every customer interaction across multiple channels in real time by analyzing Big Data?

This leads to transforming the operating models to a more customer-centric, integrated organization using data and analytics as the basis for decision making. The transformation can be started with very simple questions:

  • Who are my “best” customers?
  • Who should I target for promotion?
  • How should I vary my promotion to different customers?
  • What product should I sell at what channel and at what price?
  • How should I keep the supply and demand in absolute balance?

A series of predictive models for each one of these questions will establish a framework to manage the customer life cycle. To achieve this, you  use a variety of techniques, such as segmentation, link analysis, propensity, forecasting and more.

What do you think? We look forward to hearing from you.

See more about Amick Brown , SAP Silver Services Partner


Brainteaser: Storyboard or Dashboard…Self-Service or Managed…you choose

By Iver Van de Zand, SAP

If there is one term that always is food for discussion when I talk to customers, it is definitely “dashboard”. What exactly is a dashboard, how close is it to a storyboard, are dashboard only on summarized data and when to use a dashboard versus a storyboard. Tons of questions that already start in a bad shape because people have other perceptions of what a dashboard really is. And let’s be honest; take a canvas, put a few pies on it and a bar-chart, and people will already mention it as a dashboard. Let’s see whether we can fine-tune this discussion a bit.

A Dashboard

A business intelligence dashboard is a data visualization technique that displays the current status and/or historical trends of metrics and key performance indicators (KPIs) for an enterprise. Dashboards consolidate and arrange numbers, metrics and sometimes performance scorecards on a single screen. They may be tailored for a specific role and display metrics targeted for a single point of view or department. The essential features of a BI dashboard product include a customizable interface and the ability to pull real-time data from multiple sources. The latter is important since lots of people think dashboards are only on summarized data which is absolutely not the case; dashboards consolidate data which may be of the lowest grain available! Key properties of a dashboard are:

  1. Simple and communicates easily and straight

  2. Minimum distractions, since these could cause confusion

  3. Supports organized business with meaning, insights and useful data or information

  4. Applies human visual perception to visual presentation of information: colors play a significant role here

  5. Limited interactivity: filtering, sorting, what-if scenarios, drill down capabilities and sometimes some self-service features

  6. They are often “managed” in a sense that the dashboards are centrally developed by ICT, key users or a competence center, and they are consumed by the end-users

  7. Offer connectivity capabilities to other BI components for providing more detail. Often these are reports with are connected via query-parsing to the dashboards

A Storyboard

Is there a big difference between a storyboard and a dashboard? Mwah, not too much: they both focus on communicating key – consolidated – information in a highly visualized and way which ultimately leaves little room for misinterpretation. For both the same key words apply: simple, visual, minimum distraction.

The main difference between a dashboard and a storyboard is that the latter is fully interactive for the end user. The interactivity of the storyboard is reflected through capabilities for the end user to:

  • Sort

  • Filter data: include and exclude data

  • Change chart or graph types on the fly

  • Add new visualizations on the fly; store and share them

  • Drill down

  • Add or adjust calculated measures and dimensions

  • Add new data via wrangling, blending or joining

  • Adjust the full layout of the board

  • Create custom hierarchies or custom groupings

  • Allow for basic data quality improvements (rename, concatenate, upper and lower case etc)

Another big difference between dashboards and storyboards is that storyboards are self-service enabled boards meaning the end user creates them him/herself. Opposite to dashboards that are typically “managed” and as such are created centrally by ICT, key users or a BICC, and are consumed by the end user.

A Dashboard versus a Storyboard

So your question, dear reader, is “what is the day-to-day difference and what to you use when”? Well the answer is in the naming of both boards:

The purpose of a storyboard is to TELL A STORY: the user selects a certain scope of data (which might be blended upon various sources) and builds up a story around that data that provides insights in it from various perspectives. All in a governed way of course. The story is built upon various visualizations that are grouped together on the canvas of the storyboard. These visualizations can be interdependent – filtering on one affects the others – or not. The canvas is further enriched with comments, text, links or dynamic pictures … all with the purpose to complete the story.

Storyboarding has dramatically changed day-to-day business: the statement “your meeting will never be the same” applies definitely. Your meetings are now being prepared by creating a storyboard; meetings are held using storyboards to discuss on topics and make funded decisions, simulations on alternative decisions are done during the meetings using the storyboards and final conclusions can be shared via the storyboards. Governed, funded, based on real-insights!

A dashboard has a pattern of analyzing that is defined upfront. It is about KPI’s or trends of a certain domain, and you as a user consume that information. You can filter, sort or even drill down in the data, but you cannot change the core topic of data. If the KPI’s are on purchasing information, it is on purchasing information and stays like it. You neither can add data to compare it.

In a number of situations one does not want the end user to “interact” with the information since it is corporate fixed data that is shared on a frequent and consistent time. Enterprises want that information to be shared for insights in a consistent, regular and recognizable way. Users will recognize the dashboard, consume the information and – hopefully – act upon it. Think for example about weekly or monthly performance dashboards, or HR dashboards that provide insights in attrition on recurring moments in time.

Dashboards and Storyboards: the “SAP way”

The nuances made above on dashboards and storyboards are being reflected in SAP’s Business Intelligence Suite. Its component Design Studio is a definite managed dashboarding tool. Extremely capable of visualizing insights in a simple and highly attractive way while in the meantime able to have online connections to in-memory data sources, SAP BW or semantic layers. Storyboarding is offered via the on-premise SAP Lumira or via Cloud through the Cloud for Analyticscomponent.

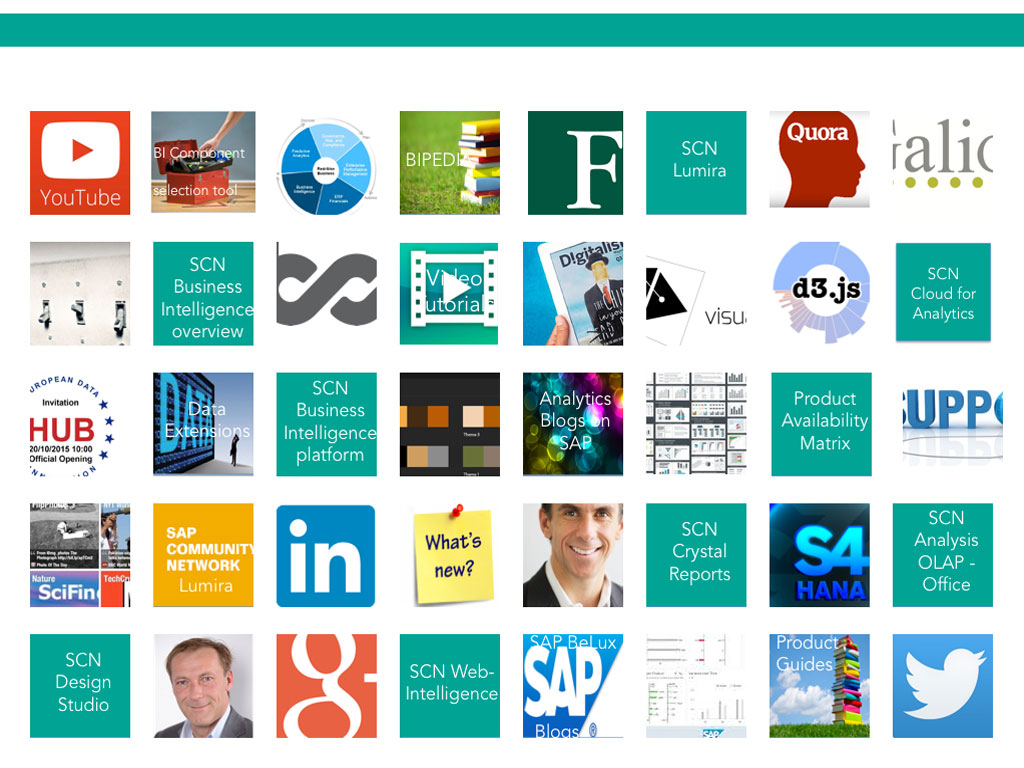
If you have difficulties deciding what to offer to your end users, the BI Componentselection tool I made easily helps you understanding whether your users require dashboards or/and storyboards. You might want to try it.

Financial storyboard

Financial storyboard

Self-service storyboard created in around 45 minutes using SAP Lumira. On this page the heat-map section that allows for white spot analyses. Data can be exported at any time. User has numerous capabilities to add data, visualizations and additional pages

Retailing Dashboard

Financial storyboard

Financial storyboard

Self-service storyboard created in around 45 minutes using SAP Lumira. User has numerous capabilities to add data, visualizations and additional pages

What you should consider when embarking on an Advanced Analytics journey?

By Paul Pallath, PHD,  Chief Data Scientist & Director Advanced Analytics, SAP

In my previous Predictive blog, I introduced four main considerations that organizations need to keep in mind when they’re beginning that journey. Today, I’ll cover them in more detail.

1. How Do We Measure Business Value and Return on Investment?

An advanced analytics solution must make a measureable impact. If not, the solution doesn’t get noticed, never mind appreciated. This holds even more true, if the return on investment (ROI) can’t be realized as a significant opportunity to drive business growth or new market opportunities.

Take the example of a marketing campaign. The ROI is in having the intelligence to target the customers who are likely (if persuaded) to buy your product rather than finding customers who would have bought the product without any marketing required.

An advanced analytics solution will be short-lived if it creates a “wow” effect, but nothing else.  The solution must generate recurrent value, revenue, and business opportunities.

2. How Do We Use Advanced Analytics Effectively?

For your business, good questions to ask at the start of the journey are:

  • Is the enterprise truly digital?
  • Is there a single source of truth of all the data that is generated/captured by various functions of the enterprise?

These questions are important considerations. Why? Because businesses often approach advanced analytics in an ineffective manner.

Remember, advanced analytics drive value to every business function, be it marketing, finance, human resources, and so on. However, enterprise functions want often to embed advanced analytics into their business workflow and embark on advanced analytics initiatives in silos. Though there is value in doing so, the results can be underwhelming.

This is because they’re using adoptions of various technologies, methodologies, practices to address the use cases that might exists— but without an enterprise-wide vision for advanced analytics. Therefore, walls rather than bridges are built between the various functions.

The problem becomes self-perpetuating. With increasing adoption of advanced analytics solutions in various business units, the business as a whole finds it difficult to consolidate all the activities into a central initiative and have proper discipline and governance.

The solution is to create the vision and execute it across all functions— even if the pilot starts from one or two activities. The functions must agree that advanced analytics is an enterprise-wide mission. Leadership must demonstrate belief in an analytics-driven business that it is going to provide competitive advantage. In this way, advanced analytics becomes a true company asset.

3. Is Advanced Analytics Just Another Technology Project?

Advanced Analytics is not just another technology project. If considered to be a technology project, the business understands only the technical feasibility and not its business impact.

As mentioned, an advanced analytics initiative is the means by which a business gains a competitive advantage. It follows that outcomes provide the data to help make well-informed decisions.

A lesser or confined approach is a step in the wrong direction. There is no ROI associated with technology-only thinking, because no tangible results are expected as an outcome. An initiative to embrace advanced analytics must be inseparable from your business strategy.

4. Is Big Data Equal to High Quality Insight?

Big Data is not equal to high quality insight.  A traditional business approach is to think, “We’ve captured huge amounts of data, but how do we  make sense of it?” This is a wrong start.

The right approach is to start with a business question in mind. That way, you can ask if the data that you have is sufficient enough to provide the answer.

These are several pieces of the puzzle that need to be put together for one to find meaningful, actionable insights from the data. This is, after all,  the quest that we embarked on.

As we now know, advanced analytics is about business change, insight and value.

“The combination of some data and an aching desire for an answer does not ensure that a reasonable answer can be extracted from a given body of data”-Sunset salvo. The American Statistician 40 (1).

Follow Amick Brown on LinkedIn for the best SAP Analytics and Reporting topics.

Predictive Analytics 101 – The Real Business Intelligence, part 2

by Ashith Bolar,  Director AmBr Data Labs @ Amick Brown

In my first post, “The Real Business Intelligence” ,  I emphasized on the significance of Predictive Analytics in the Business Intelligence space.  Let us take a deeper look at Predictive Analytics by way of more concrete examples.

As a refresher, Predictive Analytics is a set of tools and techniques based on statistical and mathematical techniques to analyze historical data and subsequently predict the future. The basic premise is that by analyzing historical data, determining relationships, more specifically correlations between related (and sometimes seemingly unrelated) attributes and entities, one can derive significant insights into a system. These insights can be further used to make predictions.

Let’s take a look at this process step by step.

The fundamental component in Predictive Analytics is a Predictive Model, or just model. A Predictive Model is set of data points plus a series of algorithms working on that data. It attempts to capture the relationships between the data points by means of applying mathematical or statistical computations deployed as algorithms.

The output of a model is typically a single number — called a score. The score essentially is an quantitative value for a specific prediction by the model based on historical data. Higher the score, the more likely a certain behavior is predicted. Lower the score, the more likely the opposite behaviour is predicted.

Predictive models can be built for a wide variety of problems. But the most common predictive models, especially in the context of a business application, is one that predicts people’s behaviors. Predictive models are designed to predict how people behave under new circumstances, given what we know about how they behaved in the past with other known circumstances. For instance, Netflix’s movie recommendations — based on the movies that you have seen and rated highly (known circumstances) recommendations for new movies (unknown circumstances) are generated.

You will hear terms like “Machine Learning”, “Artificial Intelligence”, “Regression Analysis”, etc. While, each one is an independent area of mathematics and computing, for a Predictive Analytics suite, these are just different algorithms (computing models) that are employed in the process of predicting.

Let’s dig deeper into the concept of Scores. Let’s take two classical examples of scores generated on customers.

  1. Based on the movies you have seen and rated in the past, Netflix tries to determine if you will like a new movie or not. Say for instance, a scoring of 0-10: 10 being a prediction of you absolutely loving the new movie, and 0 being a prediction of you absolute not caring about it. This type of a score is called a Probability Score. In essence, the score tells you the probability of you liking a movie.
  2. Another type of score is called the Quantitative Score. Here the prediction is not the probability of whether you will like the movie or not, instead to quantitatively predict the amount of something. For instance, Life Insurance companies try to predict how long a certain customer will live based on the life choices and other circumstances of the customer.

In case of the Netflix model (Probability Score), if a customer gets a 8 (out of 10) for the likelihood of liking a particular movie, it can be rephrased as “There’s a 80% chance that the customer will like this movie, and a 20% chance that they will not like it”. Such a prediction is basing its prediction on the spread of probabilities (probability distribution). Another way of looking at this score of 8 (out of 10 is) “The customer might not absolutely love this movie (which would be a 10/10), but definitely not absolutely hate the movie (0/10). Instead the customer is more likely actually liking the movie to some extent (8/10), rather than completely disinterested (5/10).

In either case, a careful examination of this score tells us that all the system is doing is categorizing people’s behaviours into a set number of ranks. Therefore, predictive models which generate probability scores are usually called classification models. On the other hand, the quantitative scoring (predicted life expectancy of an insurance customer) is really a quantitative number. Another classic example is customer spend which is how much a customer is willing to pay for a new product or service. The actual value is reached at by means of various statistical and mathematical computations. These models are typically known as regression models.

A good predictive model might not be accurate in every single case, but given a large set of data (read target customers), the model regresses to the predicted mean of the behavior.

In the following posts, we will delve deeper into predictive algorithms, and try to gain a better understanding of how they work, and more importantly why they work, and why they are important in your corporate strategy.


Are you Planning to Embark on an Advanced Analytics Journey?

Businessman Analyzing Graph

Welcome to the new world!  The manner in which data is generated and captured today has come of age. Traditionally the way of generating data for the most part from B2C/B2B2C business processes, was by having interactions captured as part of transactional systems in a highly structured format. But with changing technological landscape, much has changed in how data is generated and captured.

What data supports this view?

According to the ESG Digital Archive Market Forecast, the growth in data volumes that is driven by unstructured data amounts to more than 88% as compared to structured data. What’s more, Computer World states that unstructured information may account for more than 70% to 80% of all data in organizations.

The change has come because we in the 21st Century have redefined the way business is conducted. Significant advancement in internet technology has forced the need for digital online presence for most businesses to stay relevant. Likewise, every interaction that a customer has in the digital online ecosystem leaves behind a digital foot print containing huge amount of information.

Social media presences, for individuals and businesses, have increased the speed at which information travels. This has made it possible to share opinions as blogs or multimedia content. The result is the constant generation of large amounts of unstructured data.

All that Unstructured Data Is Good News for Data Scientists

However, this is good news for data scientists.

The previous figures imply that we have now Yottabytes [1024] of data at our disposal for deriving business value—and that amount of data is about to increase.

The Internet of Things with its emphasis on completely connected systems has resulted in the availability of high speed streaming data. This makes it possible for new innovations that use data to build technologies to enable machines talk to one another (and perhaps eventually become intelligent enough to remove humans from the loop)! Taking the trend into consideration, Brontobytes [1027] of data to work with will soon be a reality for data scientists.

So, what is the best way for a business to capture and benefit from this information? Of course, capturing the massive swathes of data available is an important part of the Big Data story. But it’s not the most important part.

The most vital activity is to generate insights that add value to your business. This takes vision, it takes change, it takes…advanced analytics.

For organizations embarking on a journey into advanced analytics, it’s vital to keep in mind these important considerations:

  • How Do We Measure Business Value and Return on Investment?
  • How Do We Use Advanced Analytics Effectively?
  • Is Advanced Analytics Just Another Technology Project?
  • Is Big Data Equal to High Quality Insight?

In future blogs, I’ll discuss each one of these considerations in more detail.

Let me know what you think. Did I leave one off the list?

Amick Brown would sincerely like to Thank Dr, Pallath for his contribution today .

“Passionate on Analytics” , new book available

from Iver van de Zand

My book “Passionate On Analytics” is available now

Driven by a deep believe of the value of business analytics and business intelligence in the era of Digital Transformation, the book explains and comments with insights, best practices and strategic advices on how to apply analytics in the best possible way. 25 Years of analytics hands-on experience come together in one format that allows any analytics userHow proud can one be?

My first book titled “Passionate on Analytics” is now available from the Apple iBooks Store via this link.

Since I am evangelizing on interactive analytics every single day, I decided to create aninteractive ePub book. It contains over 60 best practice and tutorial videos, tons of valuable links and galleries and 33 extended articles providing insights on various analytics related topics.

Passionate on Analytics (206p) has 4 sections:

  1. Insights: 13 deep dive articles on various aspects of business analytics like industry specific approaches, embedded analytics and many more
  2. Strategy: 13 chapters talking analytics strategy related subjects and topics like defining your BI roadmap or the closed loop portfolio
  3. Best Practices: 10 expert sessions showing and demonstrating best practices in business analytics like using Hitherto charts, how to make a Pareto or visualization techniques
  4. Resources: a wealth (!) of resources on analytics

Please find below some screenshots.

I am very happy with the book with has brought up the best in me. Everything I learned, experienced or discussed during my 25 years tenure in business analytics, is expressed in this book. The book is fully interactive meaning you can tap pictures for background, swipe through galleries or start an tutorial video.

Special thanks goto Ty Miller, Timo Elliott, Patrick Vandeven and Waldemar Adams who I all admire a lot.

Iver


How Real a Problem is Supply Chain Risk?

by Matthew Liotine, PHD

Operations Management and Planning Expert

 Professor at University of Illinois

 Amick Brown Strategic Advisor

Risk is a pervasive force in business, and consequently, in the supply chain operations that are necessary to support business. Supply chains will always be exposed to some level of risk, and thus firms must have the ability to manage and live with continuous risk. Despite the plethora of adverse events that have occurred around the world in the past ten years, the nature of supply chain risk has not really changed. Such risk can be very complex in nature, but invariably, most risk is linked to the possibility of some level of disruption in the supply chain. A disruption is created when some kind of interruption occurs and ends when operations are restored as they were prior to the disruption. Depending on the type of disruption, effects can be usually interpreted in many ways such as time, cost, unserved demand, financial and reputational damages.

Supply chain disruptions indicate that there is a problem and that existing plans and operations require some kind of improvement. To specify any kind of improvement, a firm must understand the root causes of disruption and develop measures to reduce either the likelihood of the disruption or its impact. In this article, we will explore the extent of the problem of risk in today’s supply chain. This article is the first of a series of articles in supply chain risk – in future articles we will explore the definition and sources of risk in the supply chain, the current best practices that deal with this problem, the process of analyzing risk in the supply chain, and forward looking approaches on identifying and controlling such risk.

supply chain icons

How big is the problem?

The supply chain risk problem is widespread.

  • More than 80% of companies are now concerned about supply chain resilience (World Economic Forum 2013).
  • 76% of companies surveyed had experienced a supply chain incident that caused disruption to their organization (The Business Continuity Institute 2014).
  • In 23% of the organizations, the cost of a disruption was more than $1.4 million
  •  80% of the respondents reported at least one supply chain disruption in a single year, while 42% experienced 1 to 5 disruptions per year (Alacantra 2015).
  • 52% of organizations reported having at least 21 key suppliers and 50% of the disruptions involved a supplier below Tier 1.
  • 75% of the firms studied do not have full supply chain visibility and 34% did not even record supply chain disruptions in 2014.
  • 32% of the firms showed little or no commitment towards improving supply chain resilience and 53% did not even validate supplier assurance.
  • 72% of participants did not even bother to assess supply chain vulnerabilities (IBM 2012).

The reason for this kind of neglect is rooted in the traditional clash between profitability and the costs of preparedness. In one study, 47% of procurement decision makers identified the most important key process indicators (KPIs) as being all cost related, with realized cost savings as the most important  (Xchanging 2015). The respondents also reported that preparedness and resiliency to manage risks and disruption can constitute about 20% of costs. In general, most firms will try to manage risk from two distinct perspectives, using either strategic risk management or more tactical, field level practices, or both. Larger companies with greater revenues are more sensitive to risk and liability, and invest in more sophisticated enterprise-wide risk governance programs to manage risk from a strategic perspective. Some of the available approaches used for strategic risk management include using an executive level risk board to govern enterprise risk, a shared risk registry or online database, a real time dashboard or control mechanism, or a supply chain risk management plan (University of Maryland 2010). While about half of major firms employ these approaches, less than 20% of smaller companies use them. Studies have shown that only 50% of companies have written business continuity plans and only 41% have a recovery plan to rebound after a major disaster (Travelers May 2015).

Where are the deficiencies?

A key deficiency highlighted in the aforementioned studies was a lack of collaboration between firms and key suppliers (University of Maryland 2010). Nearly half of the companies surveyed did not use any collaborative platforms and less than a third did not joint monitor disruptions. In fact, the study showed that firms tend to collaborate more with their customers than suppliers in regards to monitoring and reporting disruptions. While part of the problem are time and costs, as alluded to earlier, enterprise risk management also involves risk identification and quantification, which requires the use of empirical data. It is evident that many firms will favor information sharing with customers versus suppliers. Enterprise Resource Planning (ERP) Systems can provide a foundation for obtaining operational data that can be utilized to gauge supplier risk. However, even with such data, the ability to utilize it for the purposes of strategic risk management is lacking. There has been much research into the nature of supply chain risk, but little in evaluating strategic risk in complex supply chains, since supply chains have grown increasingly complex and dynamic due to product variety and complexity, technology, e-business, globalized outsourcing, among other factors. Altogether, there is still a need for methodologies and tools to aid firms in evaluating and managing strategic supply chain risk.

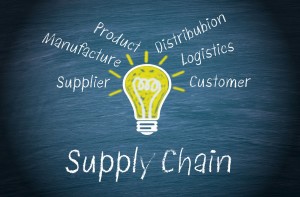
supply chain light bulb

Conclusions

It has been established that concerns about supply chain risk not only still persist, but are ever growing due to the changing nature of supply chains. Several industry studies have made the following evident:

  • Supply chain risk is a major concern for most companies, large and small;
  • Most companies experience one or a few supply chain disruptions annually, each with a significant loss;
  • Many disruptions involve key suppliers or those below Tier 1;
  • Many firms still lack commitment to controlling supply chain risk for the reasons of the costs and complexity involved;
  • Larger firms will manage risk more strategically using a combination of executive governance and/or data driven approaches;
  • While operational data is increasingly becoming available, there is yet much work to be done in leveraging such data for strategic risk management.

In the next article, we will discover what supply chain risk really means, and the leading threats giving rise to supply chain vulnerability.

Please Join the Discussion by Replying Below

Bibliography

Alacantra, Patrick. Supply Chain Trends: Past, Present and Future. The Business Continuity Institute, 2015.

IBM. IBM Index Reveals Key Indicators of Business Continuity Exposure and Maturity. IBM Global Technology Services, 2012.

The Business Continuity Institute. Supply Chain Resilience 2014 – 6th Annual Survey. The Business Continuity Institute, 2014.

Travelers. Travelers 2015 Business Risk Index: Findings from a Survey of U.S. Business Risk Decision Makers. Travelers Insurance, May 2015.

University of Maryland. Assessing SCRM Capabilities and Perspectives of the IT Vendor Community: Toward a Cyber Supply Chain Code of Practice. University of Maryland, Robert H. Smith School of Business, 2010.

World Economic Forum. Buidling Resilience in Supply Chains. World Economic Forum, 2013.

Xchanging. Xchanging 2015 Global Procurment Study. Xchanging, Inc., 2015.